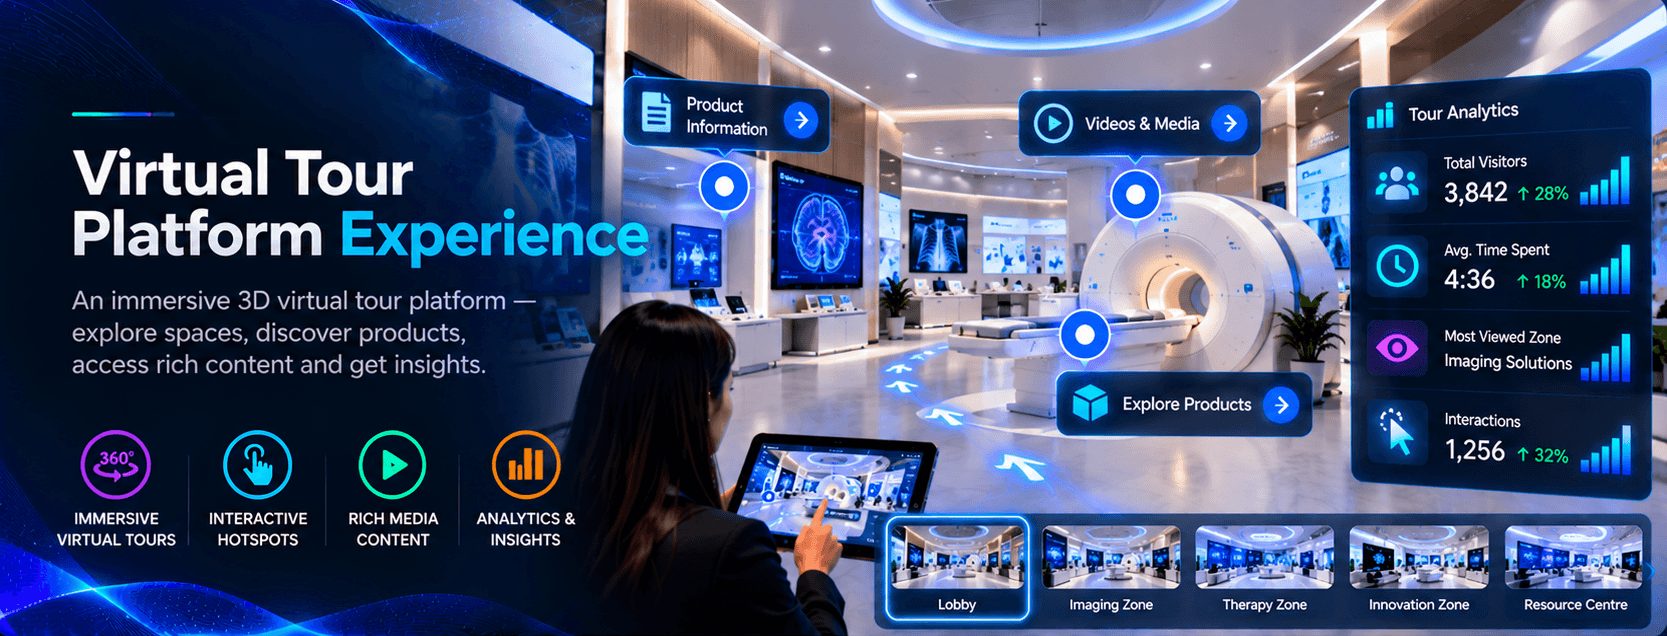
Virtual Tour Platform Experience
13 · Case Study
Virtual Tour Platform Experience
A reusable virtual tour system for exhibitions — scene navigation, hotspot layers and visitor journey measurement.
- Role
- Platform experience architect
- Context
- Multi-show deployments · Exhibition & congress
- Collaborators
- Account leadsContent strategistsAnalytics stakeholders
The Situation
Brands kept asking for “another tour” after each event, but one-off builds burned budget and learning. Scene structures, hotspots, and reporting differed every time, making year-over-year comparison impossible.
Goal & Expectations
Establish a reusable virtual tour pattern — navigation, hotspot types, analytics — that could carry different stories without reinventing delivery each show season.
Challenges
The hard parts were rarely just creative. They were floor reality, feasibility and the people who had to run it live.
Reuse vs. brand uniqueness
Each client wanted distinct atmosphere while sharing engineering costs. The platform needed flexible skinning without breaking measurement consistency.
Capture-to-publish workflow
Field teams worked under tight pre-show deadlines. Hotspot taxonomy had to be teachable to non-developers publishing under pressure.
Stakeholder dashboards
Marketing wanted depth and completion funnels, not vanity views. Event taxonomy had to align across tours for portfolio reporting.
Where I Came In
I joined to define the tour framework — scene templates, hotspot classes, and analytics hooks — used across multiple congress deployments. I documented the playbook account teams could reuse.
Approach
Standardized navigation verbs and hotspot depth levels while leaving visual and narrative layers open. Paired each deployment with a minimal reporting set leadership actually read.
What We Built
Visitors experienced brand-specific immersive spaces with familiar navigation cues. Teams published faster, and post-show reviews compared starts, depth, and completions on a shared vocabulary.
Other Teams Involved
Project managers for timelines, content strategists for story mapping, and client analytics leads for KPI alignment.
On the Floor
Supported remote tuning during load-in weeks — default views, idle loops, and kiosk timeouts — without flying engineers to every hall.
End Result
Multiple exhibitions shipped on the shared tour pattern with Looker-style engagement views comparable across shows.
Final Thought
Platforms win when producers feel faster, not constrained. I measure this work by how calmly a PM publishes hotspots two nights before open — that is when reuse either pays off or dies.
Capability notes
For teams who want the build detail: the experience drew on the tools and patterns below. The story above is what visitors and stakeholders felt on the floor.
- 3DVista
- 360° capture workflows
- Hotspot framework
- Tour analytics
Client confidential — delivered for a brand presenting in this context. The client name is withheld under NDA.