Analytics AAPM · 2 min read
AAPM Presentation Analytics
AAPM 2022 · San Diego, USA
Scientific programme engagement
- Role
- Measurement lead
- Context
- AAPM · Interactive product presentation
- Stack
- Feature Tagging · Google Tag Manager · Looker Studio
- Worked with
- Medical affairs, Demo specialists, Creative
Overview
Representative sample data
Unique visitors
3,249▲ +36% vs. baselineSessions
10,114▲ +26% vs. baselineInteractions
23,275▲ +8% vs. baselineAvg. engagement
04:22▲ +12% vs. baselineQualified leads
1,354▲ +20% vs. baselineEngagement by day
Top experiences
Visitors by region
- North America56%
- Europe23%
- Asia Pacific13%
- Latin America5%
Representation only. This dashboard and its figures are generated sample data that show the kind of reporting I build. No client data, client names or client-related work is used or shared here.
01 The question
Specialist presentations jumped modules constantly.
Without tagging, nobody knew which stories earned time and which were skipped under live demo pressure.
Show which presentation modules were opened, revisited and used in real demos — so content could improve for the next cycle.
Interactive presentations only become smarter when the measurement model matches how specialists actually talk.
02 What we tagged
I designed the feature/module taxonomy with demo leads, instrumented the interactive presentation platform, configured GTM plus capture scripts, and built a Looker Studio that mirrored how they actually present.
Custom tags lived inside the interactive presentation engine from the related AAPM work — module opens, feature taps and session resets fired into a shared data layer so live demos and post-show reporting used one vocabulary.
- Interactive product presentation modules
- Feature deep-dives for specialist demos
- Live jump paths and explore mode
- Scientific / education content layers
- On-demand session and abstract interest signals
- 01Module / feature opens
- 02Slide and path jumps
- 03Hotspot and detail taps
- 04Presentation start / reset
- 05Revisits and dwell signals
- 06Explore vs presenter-led mode
03 The pipeline
From a tap on the floor to a chart in the debrief.
Custom tags lived inside the interactive presentation engine from the related AAPM work — module opens, feature taps and session resets fired into a shared data layer so live demos and post-show reporting used one vocabulary.
04 The dashboard
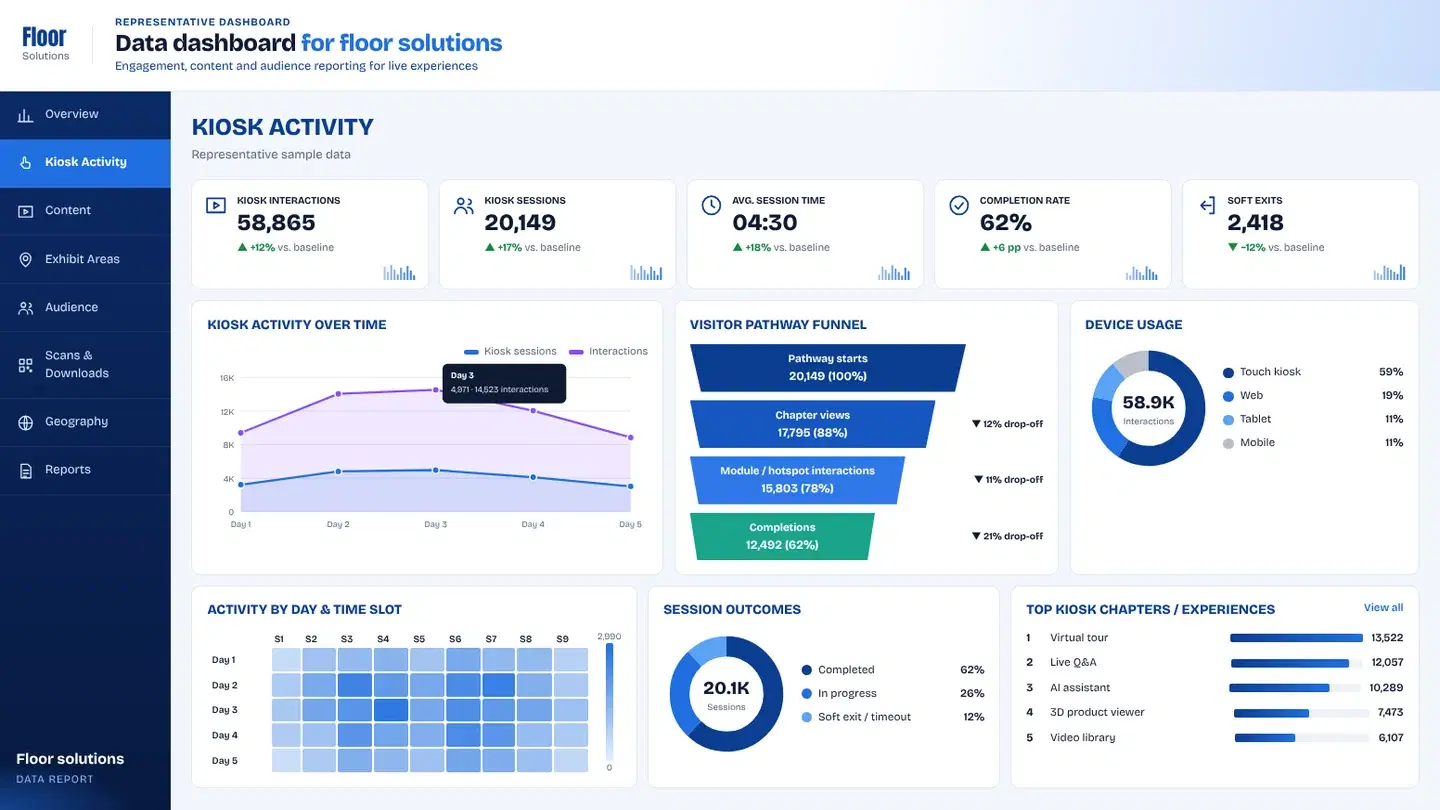
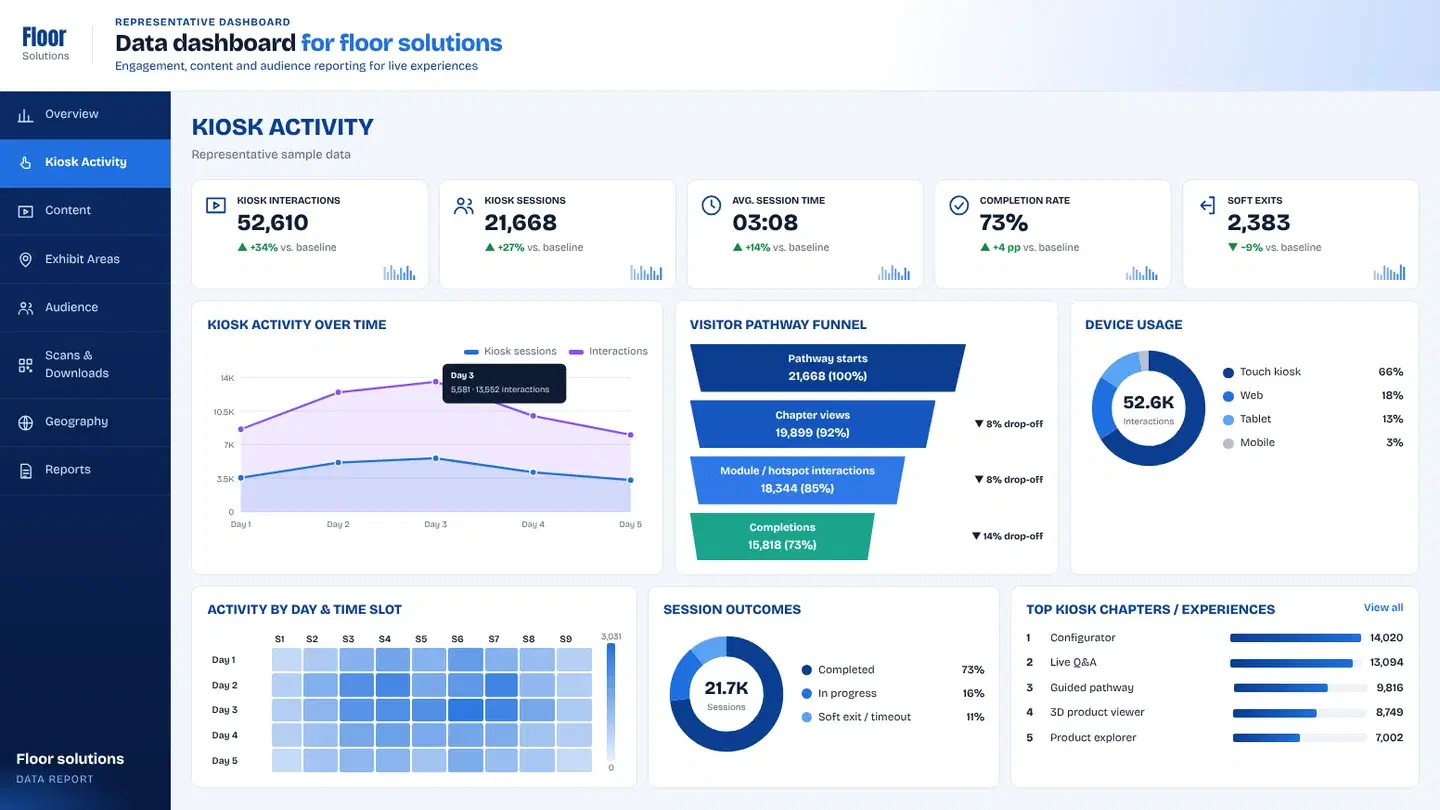
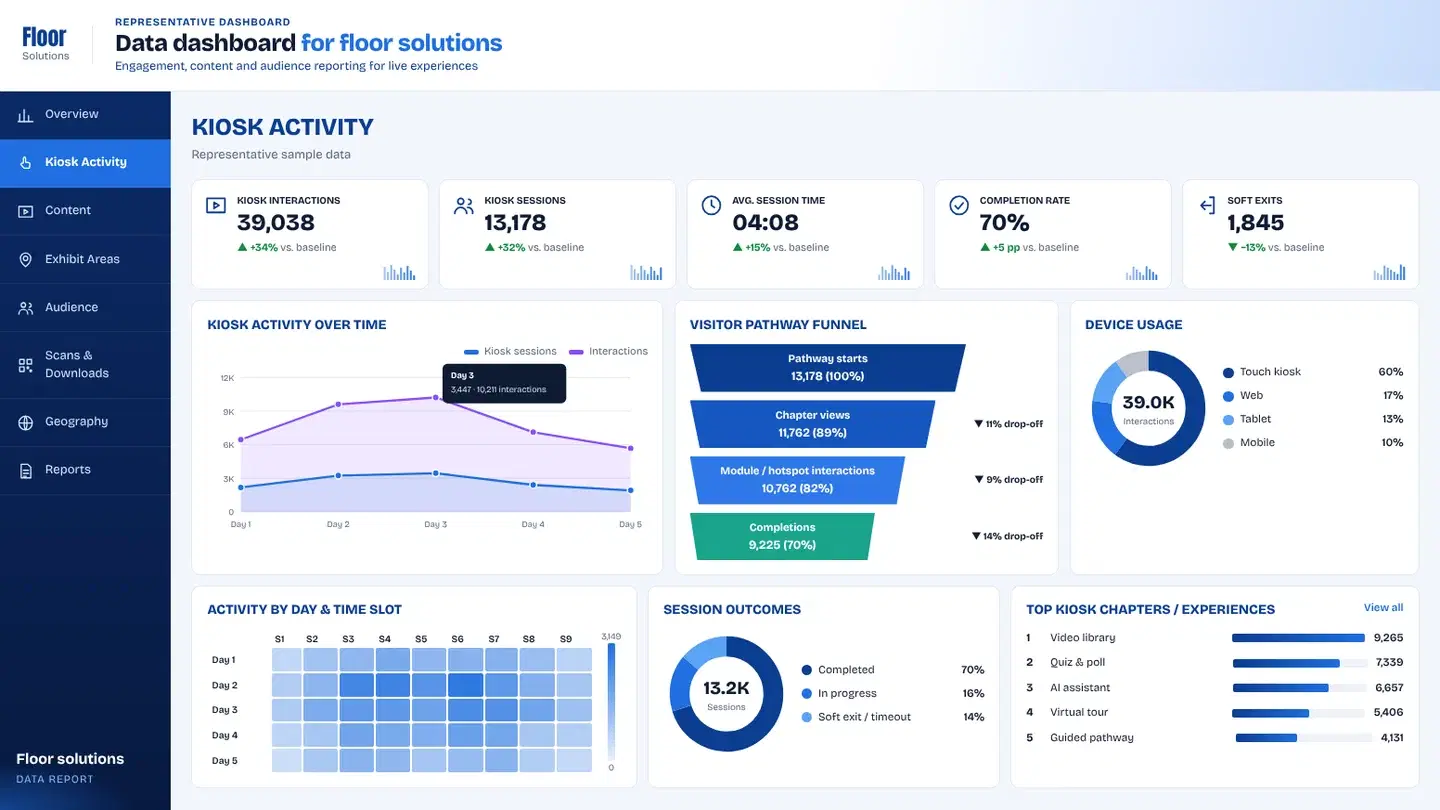
The studio board breaks the congress into tabs stakeholders already use — so scientific and product teams can brief without learning a new BI language.
- 01Overview
Attendees, session views, engagement time and abstract interest — the week’s headline for leadership.
- 02Attendees
Who showed up and how engagement concentrated across the meeting days.
- 03Scientific Program
Track and session interest so medical affairs sees which stories carried the room.
- 04Education & Posters
Education assets and poster engagement beyond the live presentation.
- 05Industry
Exhibit and industry touchpoints tied back to presentation modules used on the floor.
- 06Geography
Regional mix for global briefing packs.
- 07Reports
Export views for content owners deciding what to keep, cut or rewrite.
Key takeawayDashboards highlighted top modules, unused chapters and paths that appeared most often in live conversations.
▶ Try the dashboard
Every tap, tagged — explore a working board.
A live demo of the same capture-to-dashboard setup, with sample data instead of client numbers.
05 What changed
Specialist presentations jumped modules constantly. Without tagging, nobody knew which stories earned time and which were skipped under live demo pressure.
- 01
Content owners defended what to keep, cut or rewrite based on real floor use.
- 02
Demo leads adjusted default talk tracks; product marketing prioritized modules that earned revisits over ones that only looked good in rehearsal.
- Module opens
- Path jumps
- Revisits
- Session length
- Unused content
Client confidential — delivered for a brand presenting in this context. The client name is withheld under NDA.
+ Related analytics
Want this level of insight from your next event?