Analytics ERS · 2 min read
ERS Virtual Tour Analytics
ERS 2022 · Barcelona, Spain
Congress journey & venue heatmap
- Role
- Tour analytics lead
- Context
- ERS · 360° virtual tour
- Stack
- Hotspot Taxonomy · Google Tag Manager · Looker Studio
- Worked with
- Clinical content, Immersive crew, Booth ops
Overview
Representative sample data
Unique visitors
6,953▲ +36% vs. baselineSessions
13,178▲ +32% vs. baselineInteractions
39,038▲ +34% vs. baselineAvg. engagement
04:08▲ +15% vs. baselineQualified leads
1,119▲ +11% vs. baselineEngagement by day
Top experiences
Visitors by region
- North America49%
- Europe26%
- Asia Pacific16%
- Latin America3%
Representation only. This dashboard and its figures are generated sample data that show the kind of reporting I build. No client data, client names or client-related work is used or shared here.
01 The question
Virtual tours look impressive, but without scene and hotspot measurement, teams cannot tell whether visitors wandered meaningfully or bounced on the first panorama.
Show scene depth, hotspot interest and completion so the tour story could improve after the congress.
A tour without measurement is a beautiful corridor nobody can improve.
02 What we tagged
I mapped hotspot and scene events with content owners, instrumented the tour platform, set up GTM and capture scripts, and built a Looker board focused on depth and drop-off.
Scene and hotspot tags were built into the ERS virtual-tour platform from the related work — the same taxonomy content leads used to author the experience.
- 360° virtual respiratory tour
- Clinical scene narratives
- Interactive hotspot layers
- In-tour media and proof points
- 01Tour start
- 02Scene enter
- 03Hotspot open
- 04Media play
- 05Completion / exit
03 The pipeline
From a tap on the floor to a chart in the debrief.
Scene and hotspot tags were built into the ERS virtual-tour platform from the related work — the same taxonomy content leads used to author the experience.
04 The dashboard
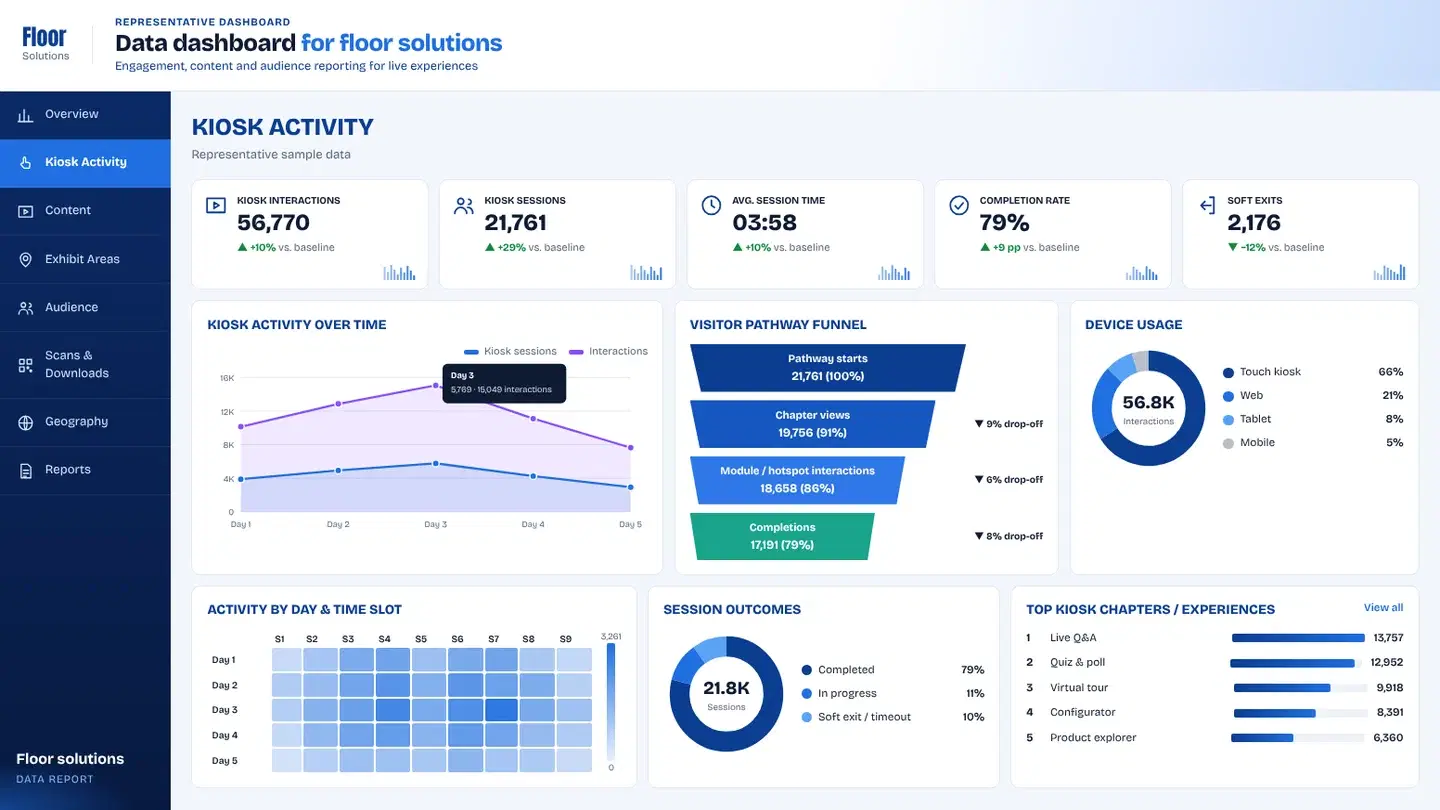
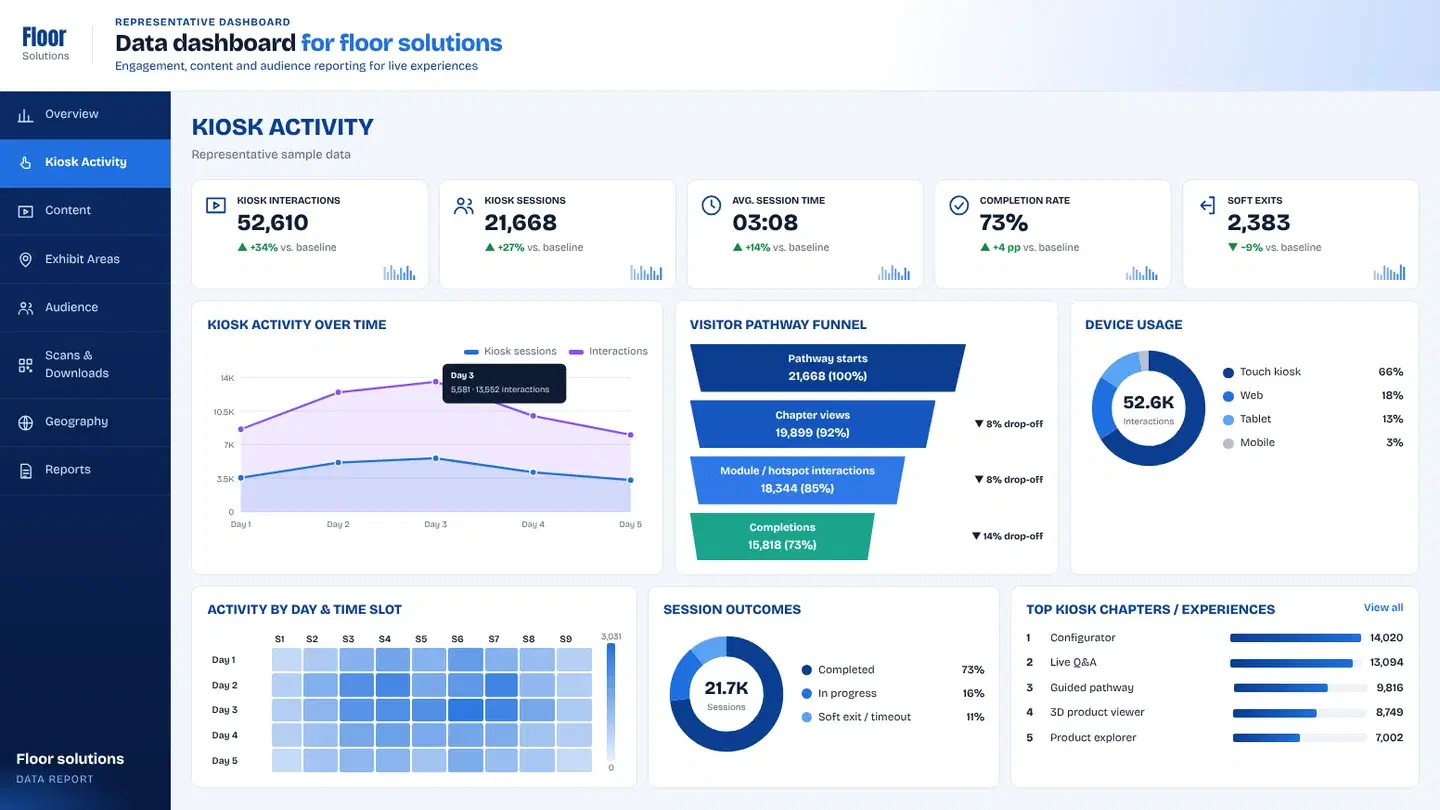
Studio tabs make a spatial journey readable — scene heat, hotspot interest and completion in one place.
- 01Overview
Starts, depth and completions for the congress window.
- 02Scenes
Which panoramas held attention and which bounced early.
- 03Hotspots
Detail-layer interest so clinical content knows what to deepen.
- 04Reports
Stakeholder exports for post-ERS content planning.
Key takeawayHeat-style interest by scene/hotspot plus completion funnels for stakeholder debriefs.
▶ Try the dashboard
Every tap, tagged — explore a working board.
A live demo of the same capture-to-dashboard setup, with sample data instead of client numbers.
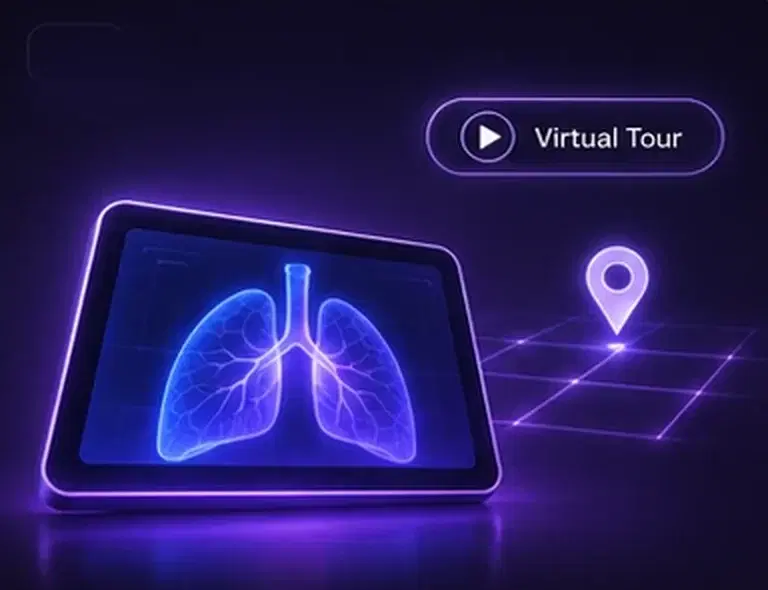 The experience we measuredERS Virtual Tour ExperienceAn immersive tour experience for respiratory congress — hotspot-led exploration with clear visitor pathways.Read the case study
05 What changed
Virtual tours look impressive, but without scene and hotspot measurement, teams cannot tell whether visitors wandered meaningfully or bounced on the first panorama.
- 01
Teams saw which spaces earned time and which content layers were ignored — then reordered scenes and hotspot depth for the next respiratory show.
- Tour starts
- Scene depth
- Hotspot opens
- Completions
- Top scenes
Client confidential — delivered for a brand presenting in this context. The client name is withheld under NDA.
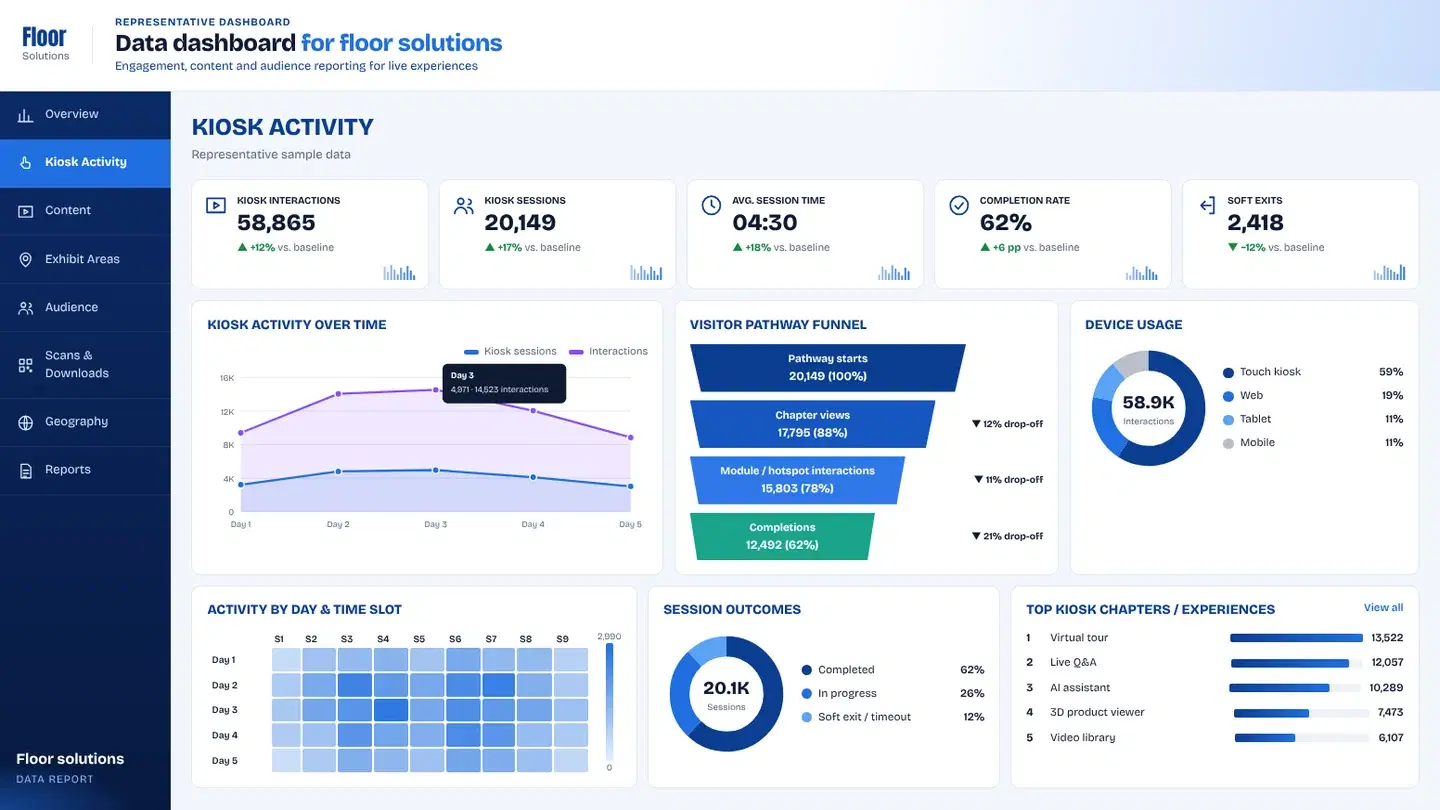
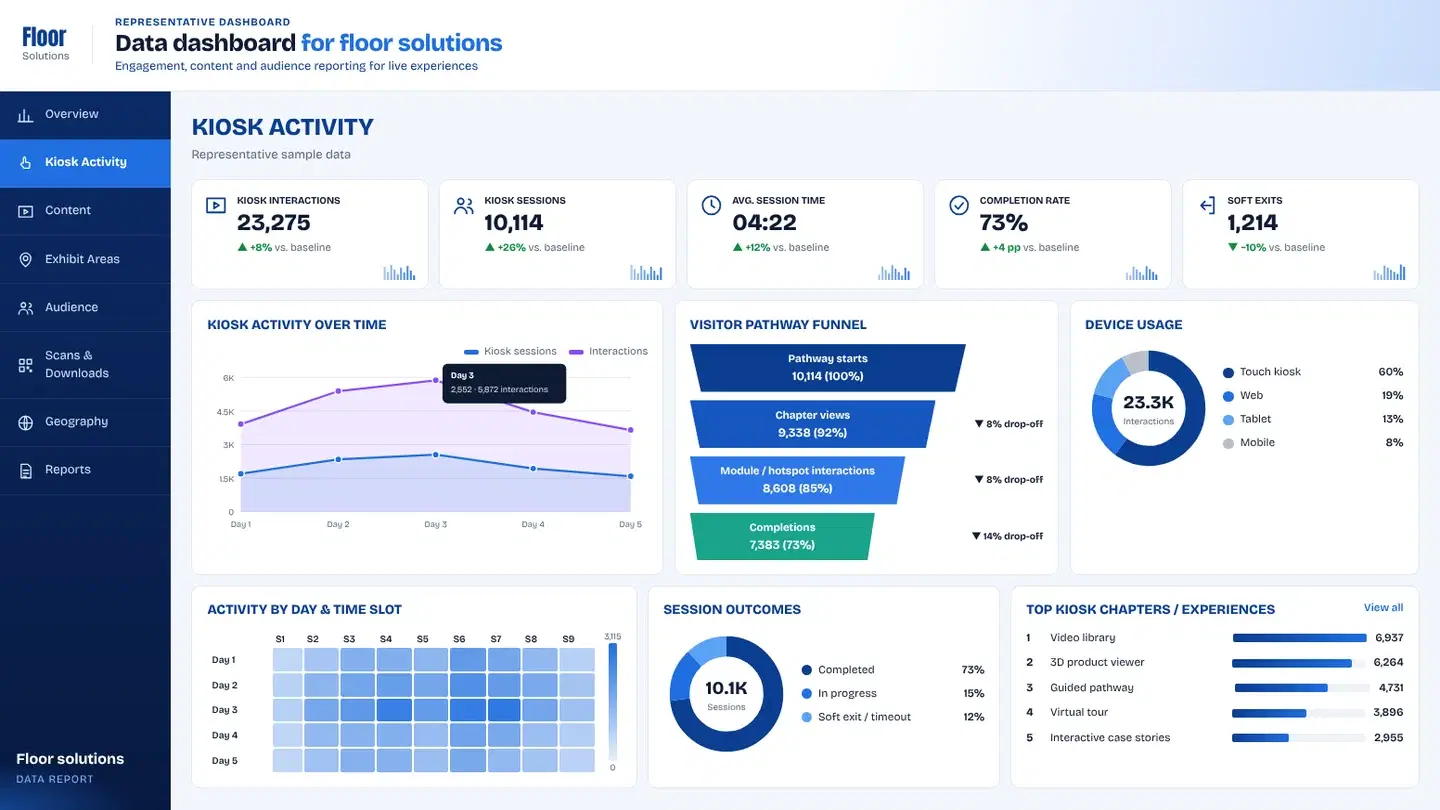
+ Related analytics
Want this level of insight from your next event?