Analytics RSNA · 3 min read
RSNA Booth Analytics
RSNA 2024 · Chicago, USA
Booth interactions & lead capture
- Role
- Analytics & measurement lead
- Context
- RSNA · Live radiology booth · Self-guided pathway
- Stack
- Custom Event Tagging · Google Tag Manager · Looker Studio
- Worked with
- Booth agency, Product marketing, Field ops
Overview
Representative sample data
Unique visitors
4,501▲ +16% vs. baselineSessions
20,149▲ +17% vs. baselineInteractions
58,865▲ +12% vs. baselineAvg. engagement
04:30▲ +18% vs. baselineQualified leads
1,324▲ +30% vs. baselineEngagement by day
Top experiences
Visitors by region
- North America43%
- Europe26%
- Asia Pacific19%
- Latin America8%
Representation only. This dashboard and its figures are generated sample data that show the kind of reporting I build. No client data, client names or client-related work is used or shared here.
01 The question
The booth felt busy all week, but leadership still asked the same question after close: which product stories actually held attention, and where did visitors drop off?
Turn walk-up pathway use into a clear post-show story — starts, depth, completions and interest signals the team could brief with confidence.
On a congress floor, measurement only matters if a tired team can open it the next morning and know what to change for the next show.
02 What we tagged
I defined what counted as a meaningful moment on the pathway, wired custom event tags into the RSNA product-pathway platform we built, stood up Google Tag Manager with capture scripts, and shaped a Looker Studio the account team could run in the debrief.
Event tags were built into the custom RSNA product-pathway platform — the same React kiosk experience covered in the related work case study. Every chapter, hotspot, CTA and soft exit pushed a named event into a shared data layer so the booth story and the measurement model stayed one system, not a bolt-on afterthought.
- Self-guided radiology product pathway (walk-up kiosk journey)
- MRI Product Explorer
- Interactive clinical cases
- 3D / VR anatomy & scanner experience
- AI diagnostic workflow demos
- Workflow solutions & clinical applications
- Research innovations zone
- Product brochures, scans and downloadable collateral
- Expert meeting / talk-to-rep handoff moments
- 01Pathway start / resume
- 02Chapter and module views
- 03Hotspot opens & detail layers
- 04UI clicks and CTA taps
- 05Presentation / demo module opens
- 06Quiz and clinical-case interactions
- 073D / VR scene and annotation opens
- 08Brochure scan & download signals
- 09Lead-capture and request-info actions
- 10Soft exit / timeout / completion
03 The pipeline
From a tap on the floor to a chart in the debrief.
Event tags were built into the custom RSNA product-pathway platform — the same React kiosk experience covered in the related work case study. Every chapter, hotspot, CTA and soft exit pushed a named event into a shared data layer so the booth story and the measurement model stayed one system, not a bolt-on afterthought.
04 The dashboard
The Looker Studio board mirrors the RSNA 2024 Event Analytics dashboard you see above.
- 01Overview
Headline KPIs — booth attendees, interactions, avg engagement time, content views and lead captures — plus day-by-day activity so leadership sees the week in one glance.
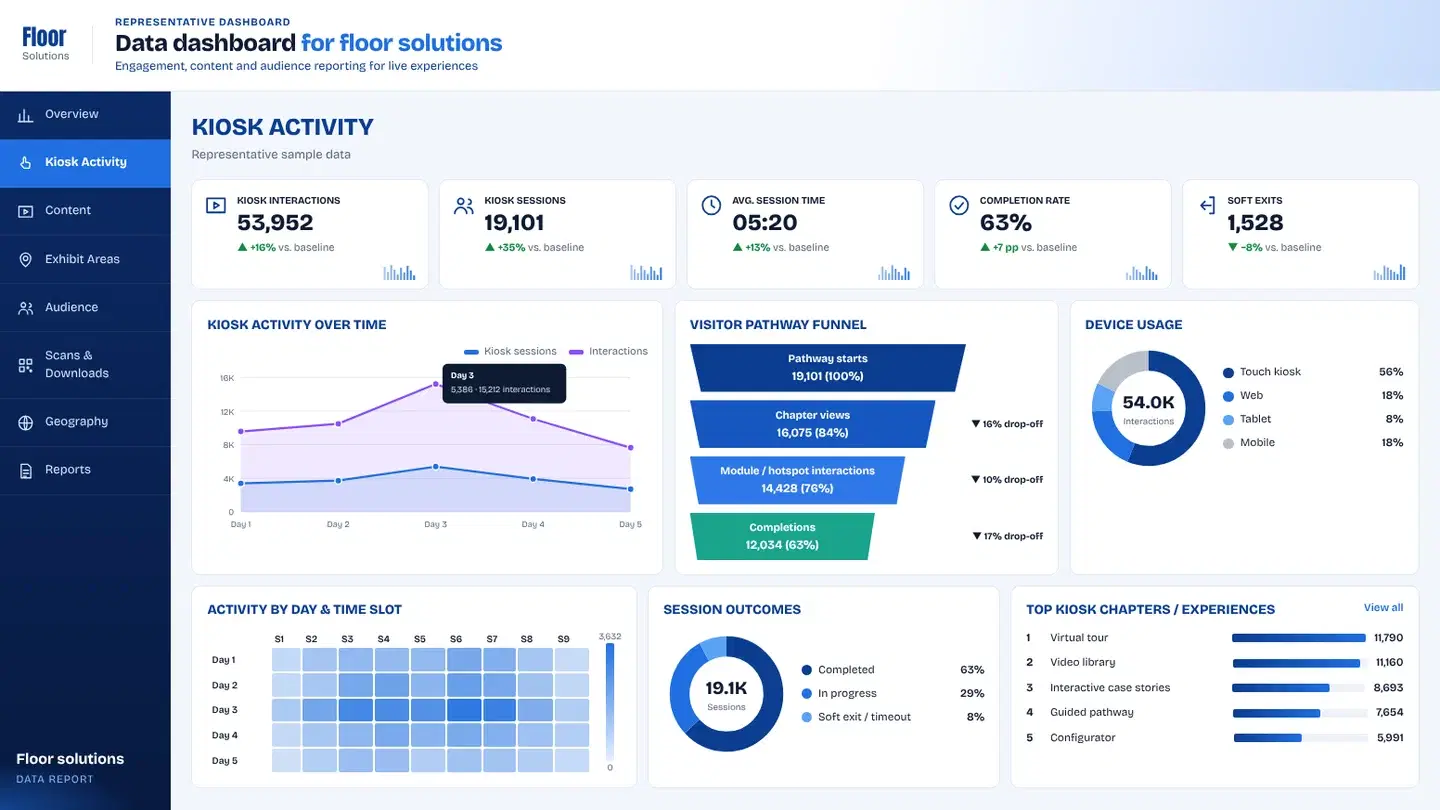
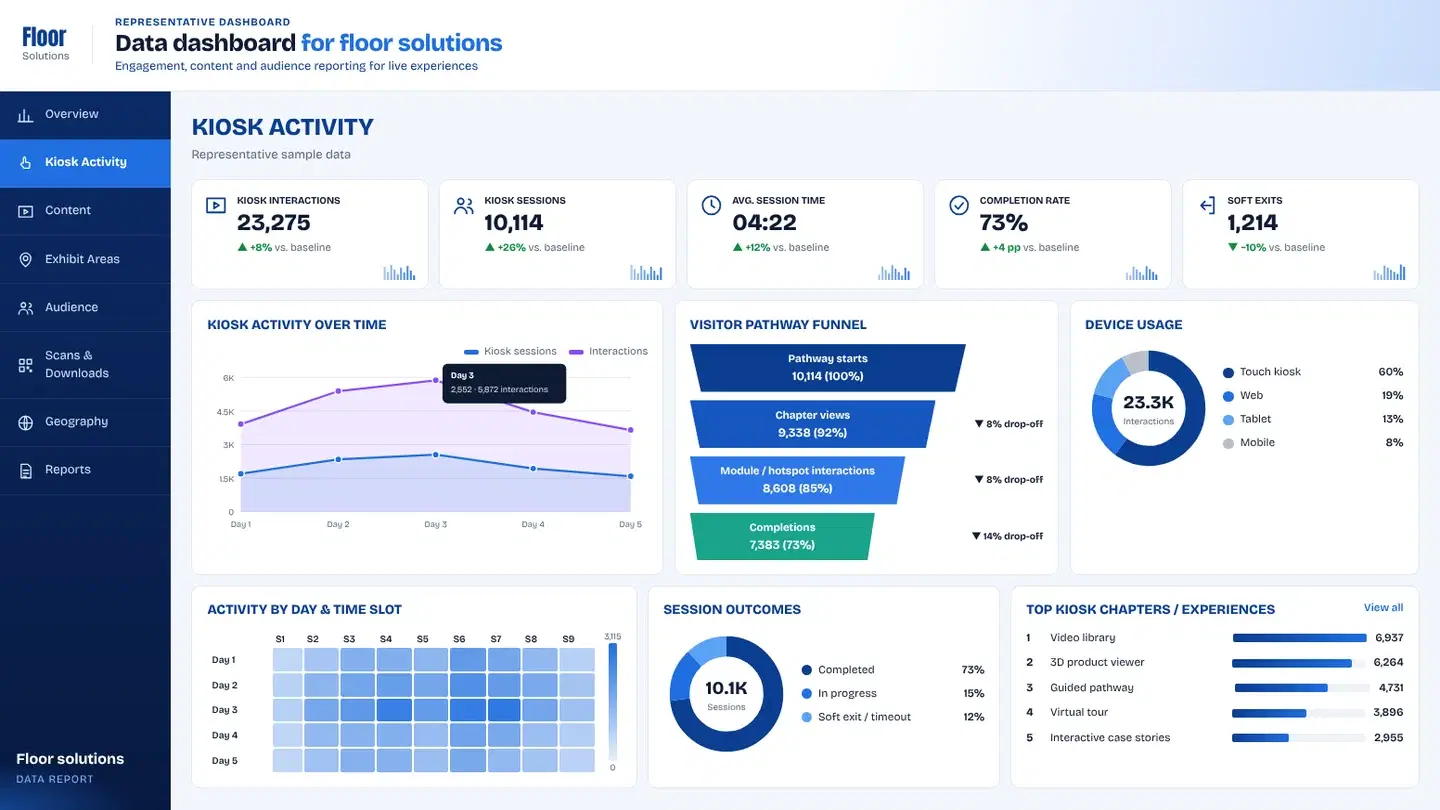
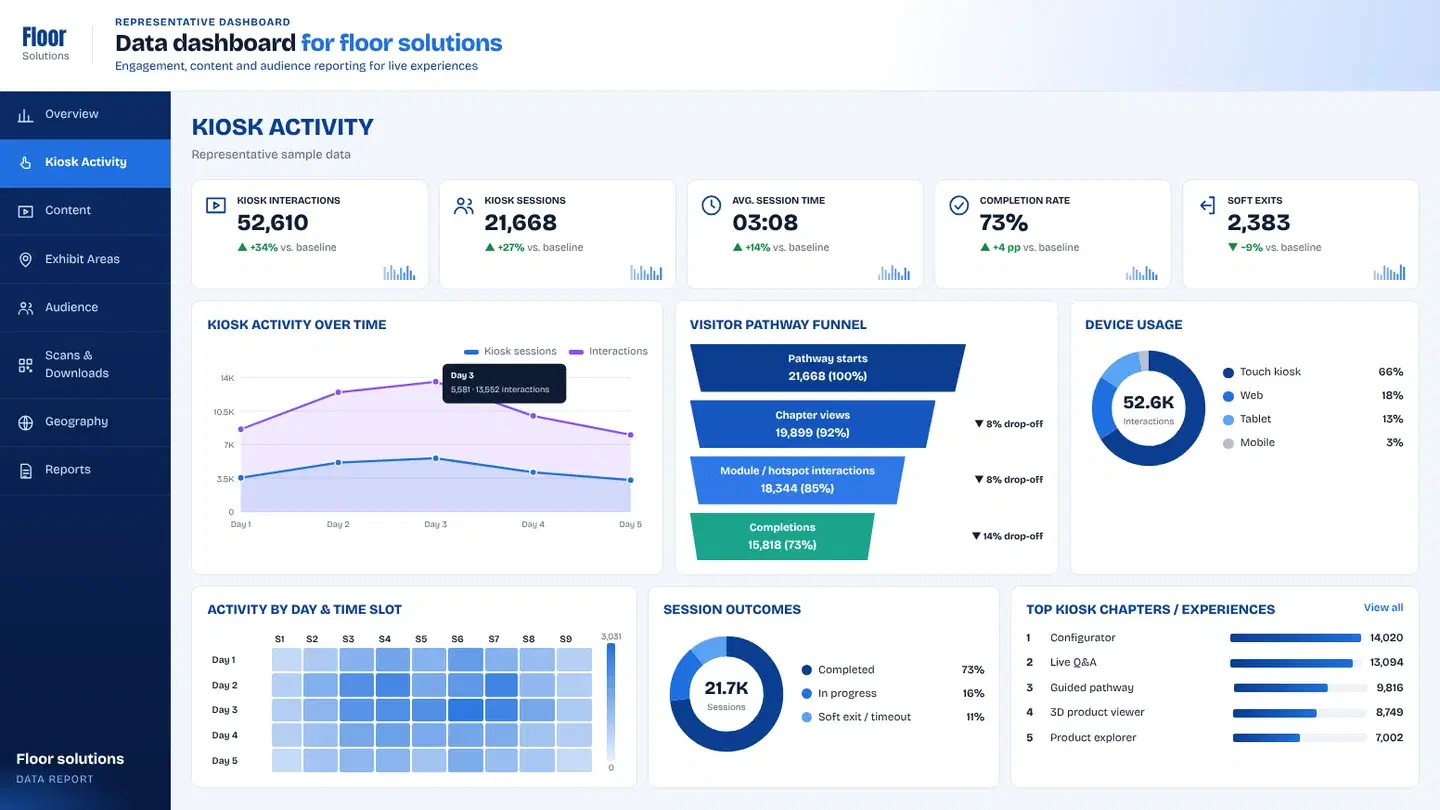
- 02Kiosk Activity
Pathway starts, depth, completions and device mix (touch kiosk, tablet, web, mobile). Shows whether the self-guided journey actually ran when staff were busy.
- 03Content
Ranked interaction content — MRI explorer, clinical cases, 3D anatomy, AI stories, brochures — so product marketing knows which assets earned attention.
- 04Exhibit Areas
Zone interest across product showcase, interactive kiosk, 3D/VR and expert meeting. Maps aisle energy to the experiences we built.
- 05Audience
Visitor mix and engagement patterns that help field teams brief follow-ups with context, not guesses.
- 06Scans & Downloads
Brochure scans, collateral downloads and request-info signals — proof of service and product interest beyond screen time.
- 07Geography
Regional breakdown of booth traffic so global and local teams share one picture of who showed up.
- 08Reports
Export-ready views for the post-show pack — same definitions the floor used all week, ready for stakeholder and partner review.
Key takeawayLooker Studio boards showed volume, depth, zone heat and drop-off in language product and booth teams already used — ready the morning after the hall closed.
▶ Try the dashboard
Every tap, tagged — explore a working board.
A live demo of the same capture-to-dashboard setup, with sample data instead of client numbers.
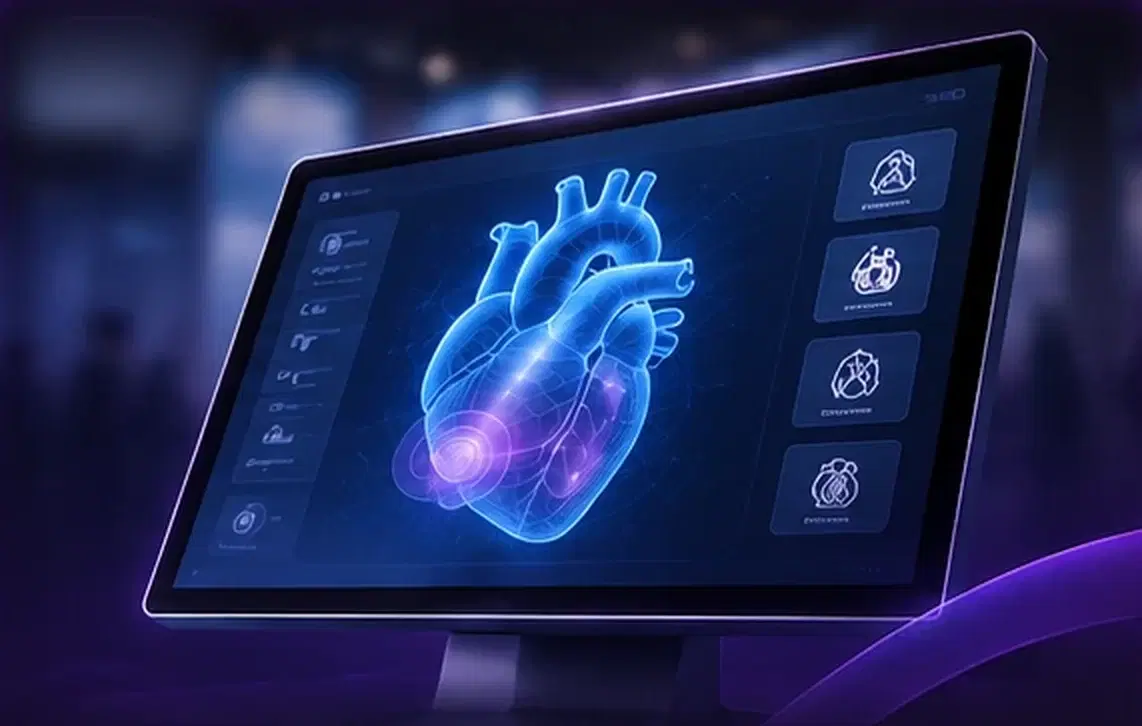 The experience we measuredRSNA Self-Guided Product PathwayA walk-up product journey for the radiology floor — clear enough for short visits, strong enough for a busy booth.Read the case study
05 What changed
The booth felt busy all week, but leadership still asked the same question after close: which product stories actually held attention, and where did visitors drop off?
- 01
The data answered three decision questions.
- 02
For the event: which days and zones deserved more staffing and demo capacity next year.
- 03
For the product: which pathway chapters, hotspots and clinical cases to keep, deepen or cut.
- 04
For the services we showcased: which demos, downloads and lead paths converted interest into conversations — so marketing and field ops could brief follow-ups with evidence instead of aisle anecdotes.
- Pathway starts
- Chapter depth
- Hotspot interest
- Quiz & case interactions
- Lead captures
- Daily traffic pattern
Client confidential — delivered for a brand presenting in this context. The client name is withheld under NDA.
+ Related analytics
Want this level of insight from your next event?