Analytics CES · 2 min read
CES Treasure Hunt Analytics
CES 2021 · All Digital
Exhibitor & content engagement
- Role
- Gamification analytics lead
- Context
- CES · Treasure hunt booth journey
- Stack
- Stage Tracking · Google Tag Manager · Completion Funnels
- Worked with
- Brand experience agency, Booth operations, Product marketing
Overview
Representative sample data
Unique visitors
3,770▲ +21% vs. baselineSessions
14,424▲ +15% vs. baselineInteractions
36,225▲ +15% vs. baselineAvg. engagement
03:03▲ +14% vs. baselineQualified leads
413▲ +10% vs. baselineEngagement by day
Top experiences
Visitors by region
- North America49%
- Europe24%
- Asia Pacific18%
- Latin America5%
Representation only. This dashboard and its figures are generated sample data that show the kind of reporting I build. No client data, client names or client-related work is used or shared here.
01 The question
Treasure hunts create energy — and messy data if stages, drop-offs and redemptions are not instrumented cleanly.
Measure starts, stage progression, drop-off and completions so the game proved dwell time and product exposure.
Gamification earns its keep when completion data survives the loudest hall of the year.
02 What we tagged
I defined stage events with ops, wired capture across kiosk/QR touchpoints into GTM, and built completion boards in Looker Studio for post-show review.
Stage and redemption tags were built into the CES hunt experience — play events and prize ops stayed separate so funnels could not fake success.
- Multi-stage treasure hunt journey
- Product exposure checkpoints
- QR and kiosk entry points
- Prize redemption desk flow
- 01Hunt start
- 02Stage enter / complete
- 03Retry / fail signals
- 04Finish
- 05Redemption
03 The pipeline
From a tap on the floor to a chart in the debrief.
Stage and redemption tags were built into the CES hunt experience — play events and prize ops stayed separate so funnels could not fake success.
04 The dashboard
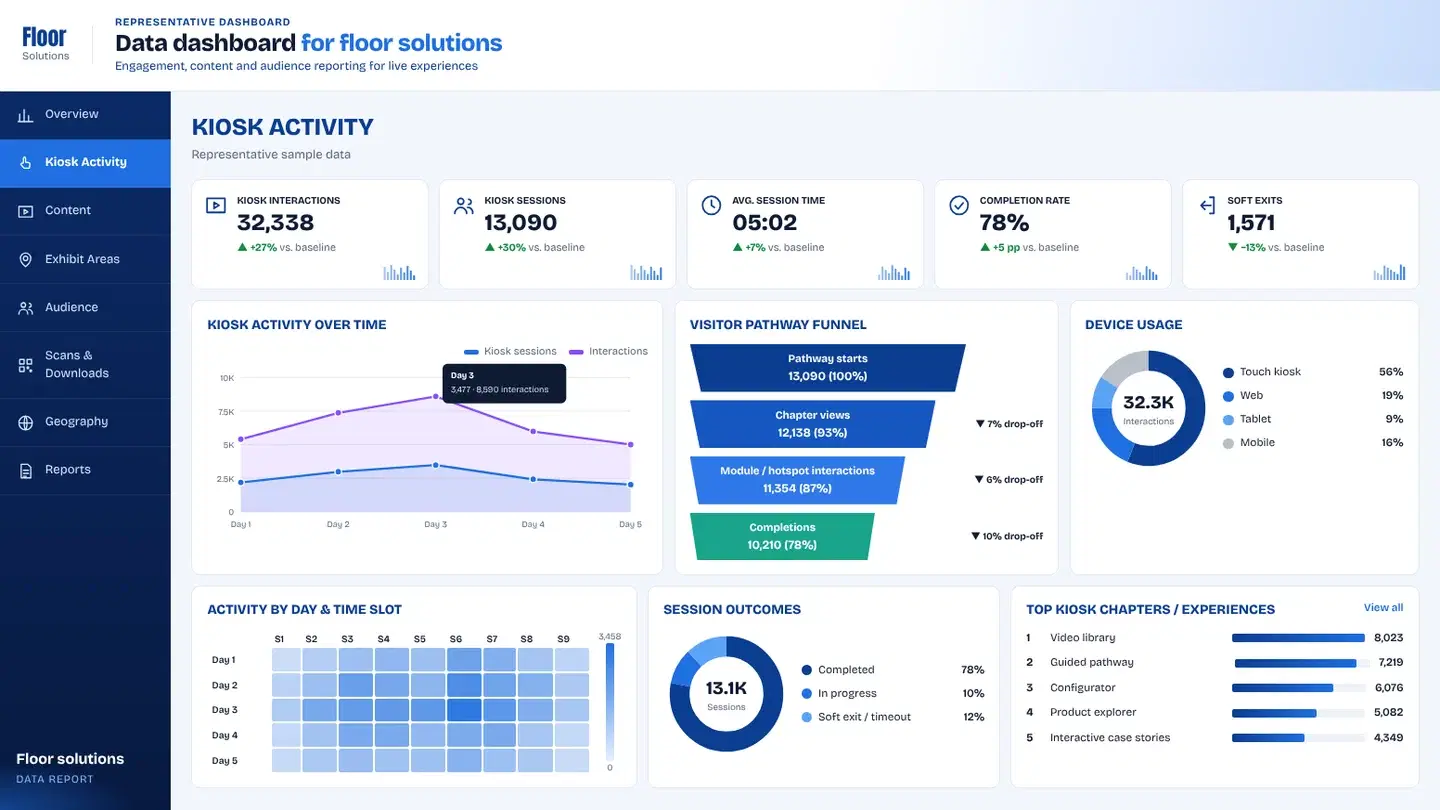
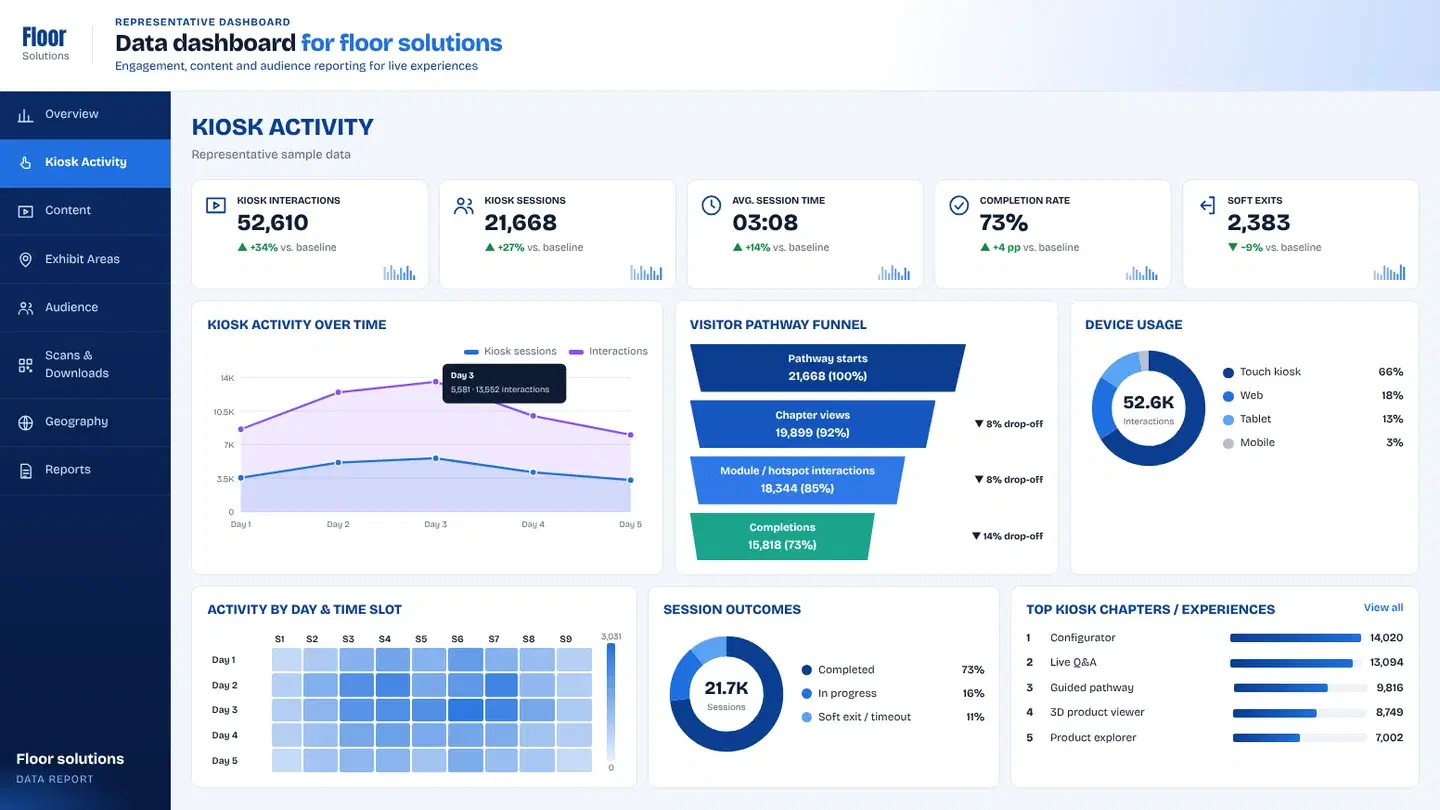
Studio tabs show journey health — where players stalled, which stages converted, and whether prizes matched play.
- 01Overview
Starts, completions and redemption at a glance.
- 02Stages
Stage-by-stage conversion and drop-off honesty.
- 03Ops
Prize desk counts without polluting play metrics.
- 04Reports
Producer exports for tuning the next hunt.
Key takeawayDashboards showed where players stalled, which stages converted, and overall completion rate.
▶ Try the dashboard
Every tap, tagged — explore a working board.
A live demo of the same capture-to-dashboard setup, with sample data instead of client numbers.
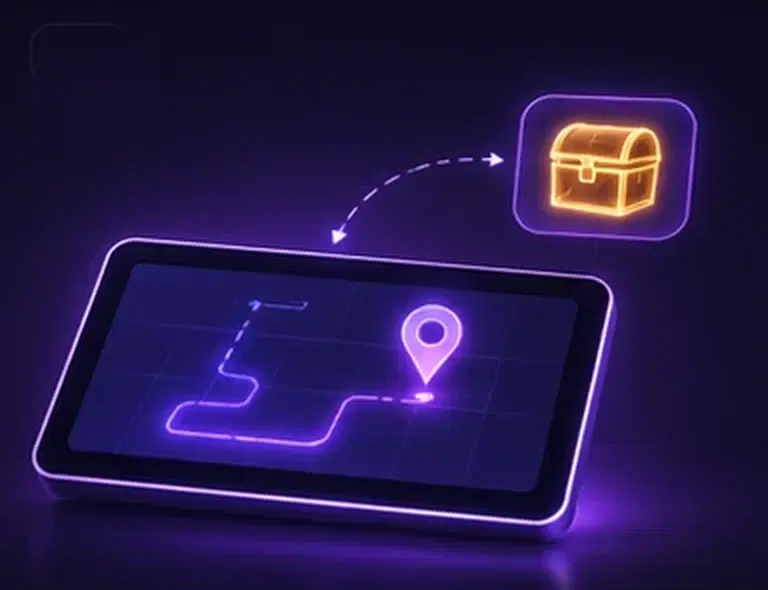 The experience we measuredCES Treasure Hunt ExperienceA playful booth journey for CES — stages, discovery moments and rewards that keep people moving through the story.Read the case study
05 What changed
Treasure hunts create energy — and messy data if stages, drop-offs and redemptions are not instrumented cleanly.
- 01
Producers tuned hard stages and staffing; marketing proved product exposure with journey depth, not only prize line length.
- Hunt starts
- Stage conversion
- Drop-off points
- Completions
- Redemptions
Client confidential — delivered for a brand presenting in this context. The client name is withheld under NDA.
+ Related analytics
Want this level of insight from your next event?