Analytics HIMSS · 2 min read
HIMSS AI Kiosk Analytics
HIMSS 2025 · Orlando, USA
Kiosk analytics & content engagement
- Role
- AI measurement lead
- Context
- HIMSS · Conversational AI kiosk
- Stack
- Topic Tagging · Google Tag Manager · Voice & Text
- Worked with
- AI product owners, Legal/medical review, Booth trainers
Overview
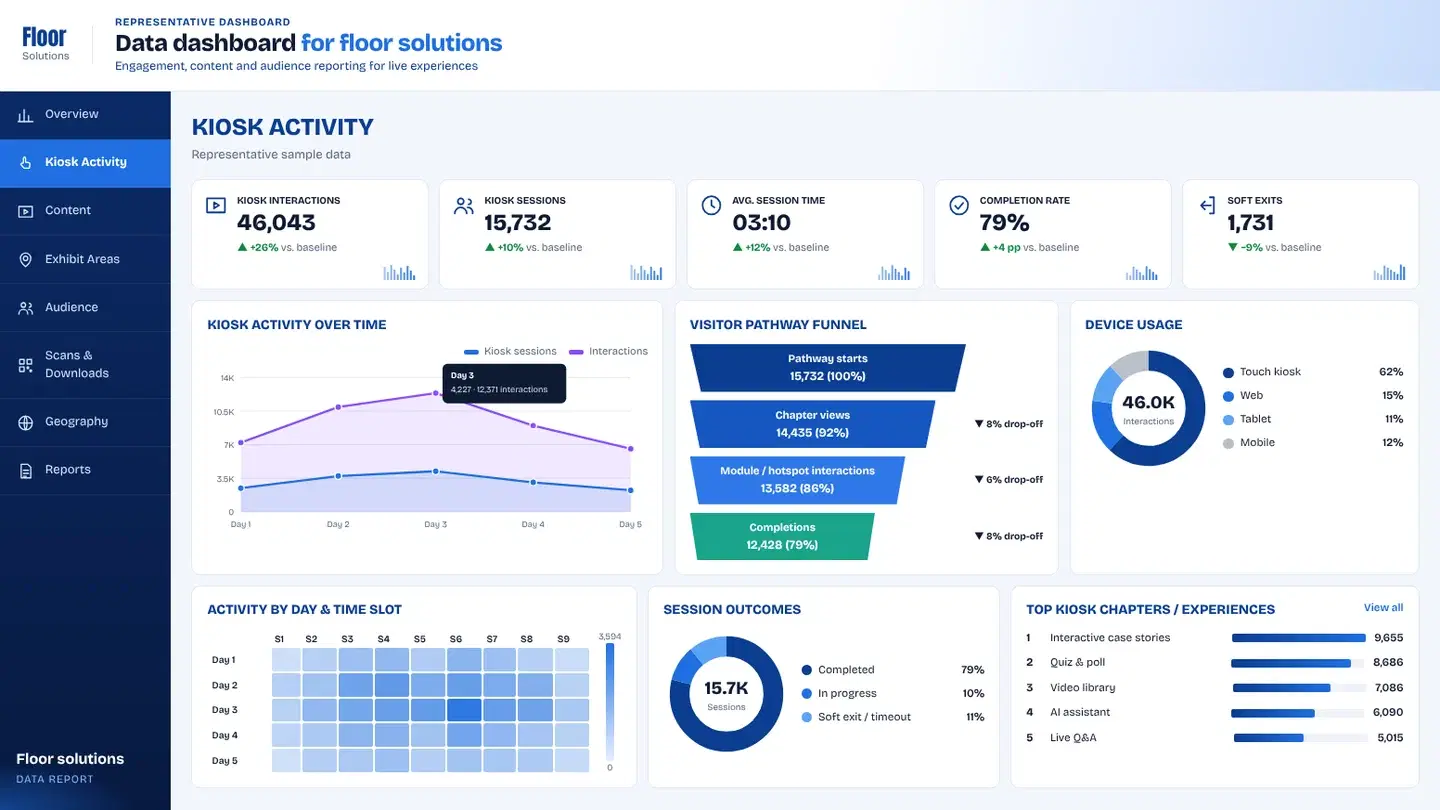
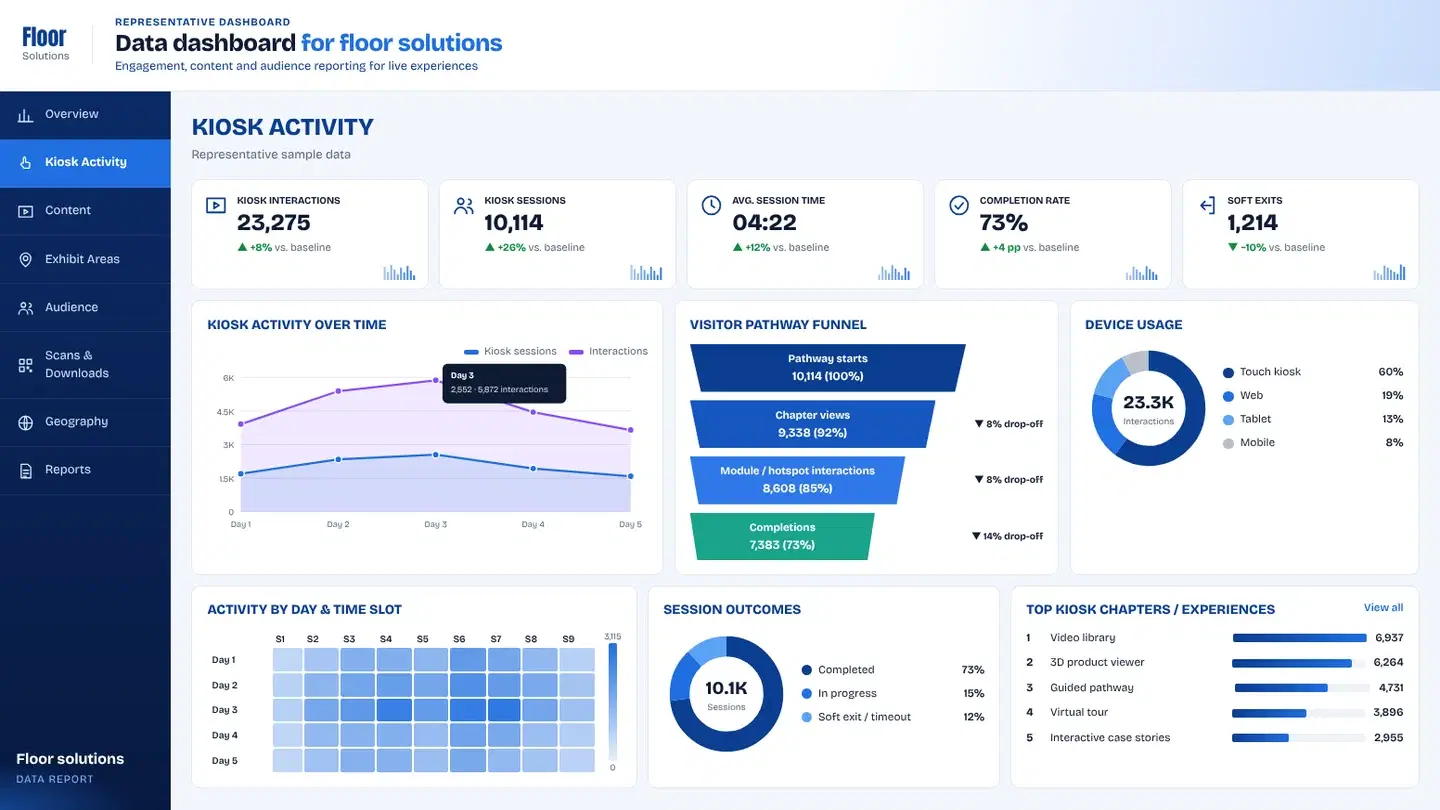
Representative sample data
Unique visitors
8,571▲ +9% vs. baselineSessions
13,090▲ +30% vs. baselineInteractions
32,338▲ +27% vs. baselineAvg. engagement
05:02▲ +7% vs. baselineQualified leads
552▲ +16% vs. baselineEngagement by day
Top experiences
Visitors by region
- North America50%
- Europe20%
- Asia Pacific21%
- Latin America4%
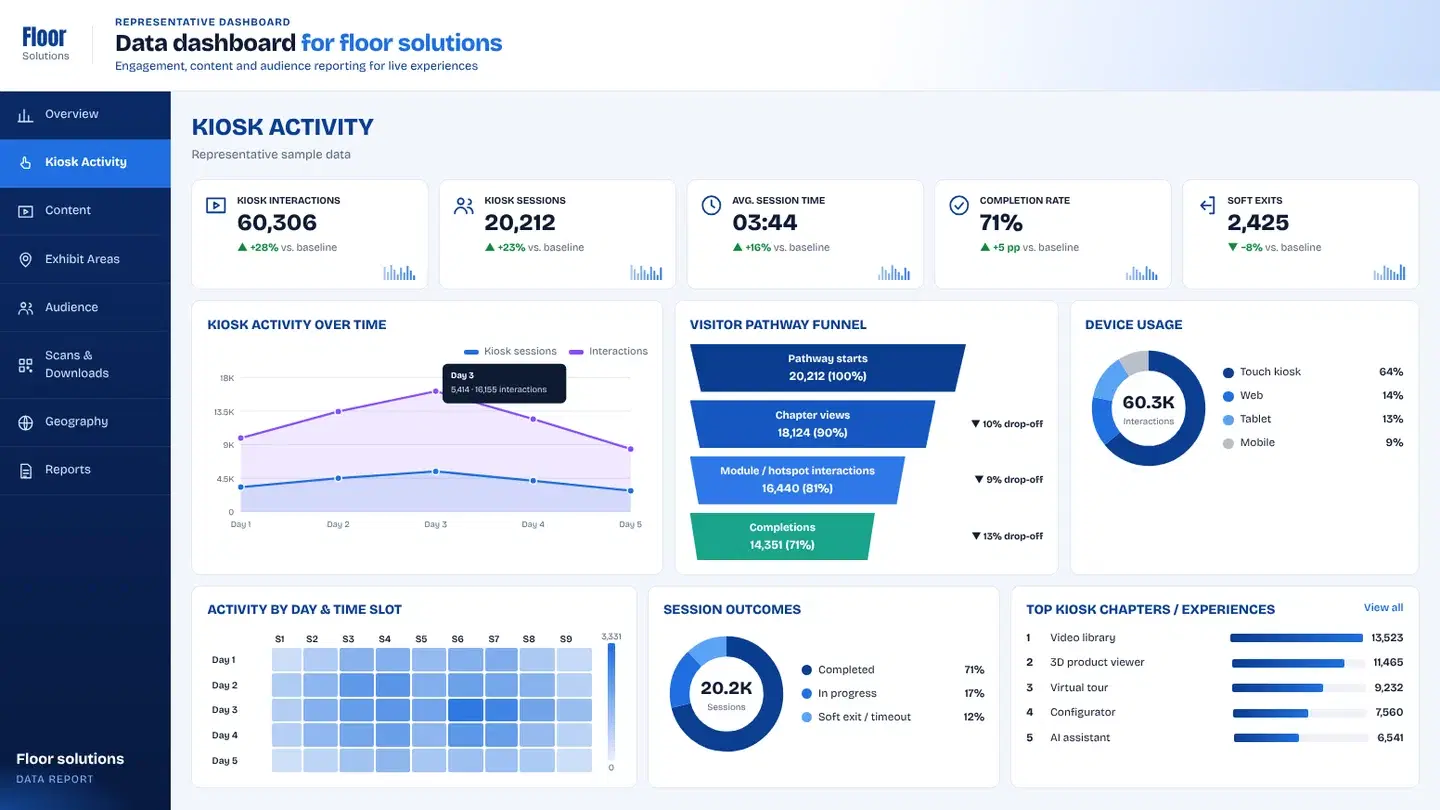
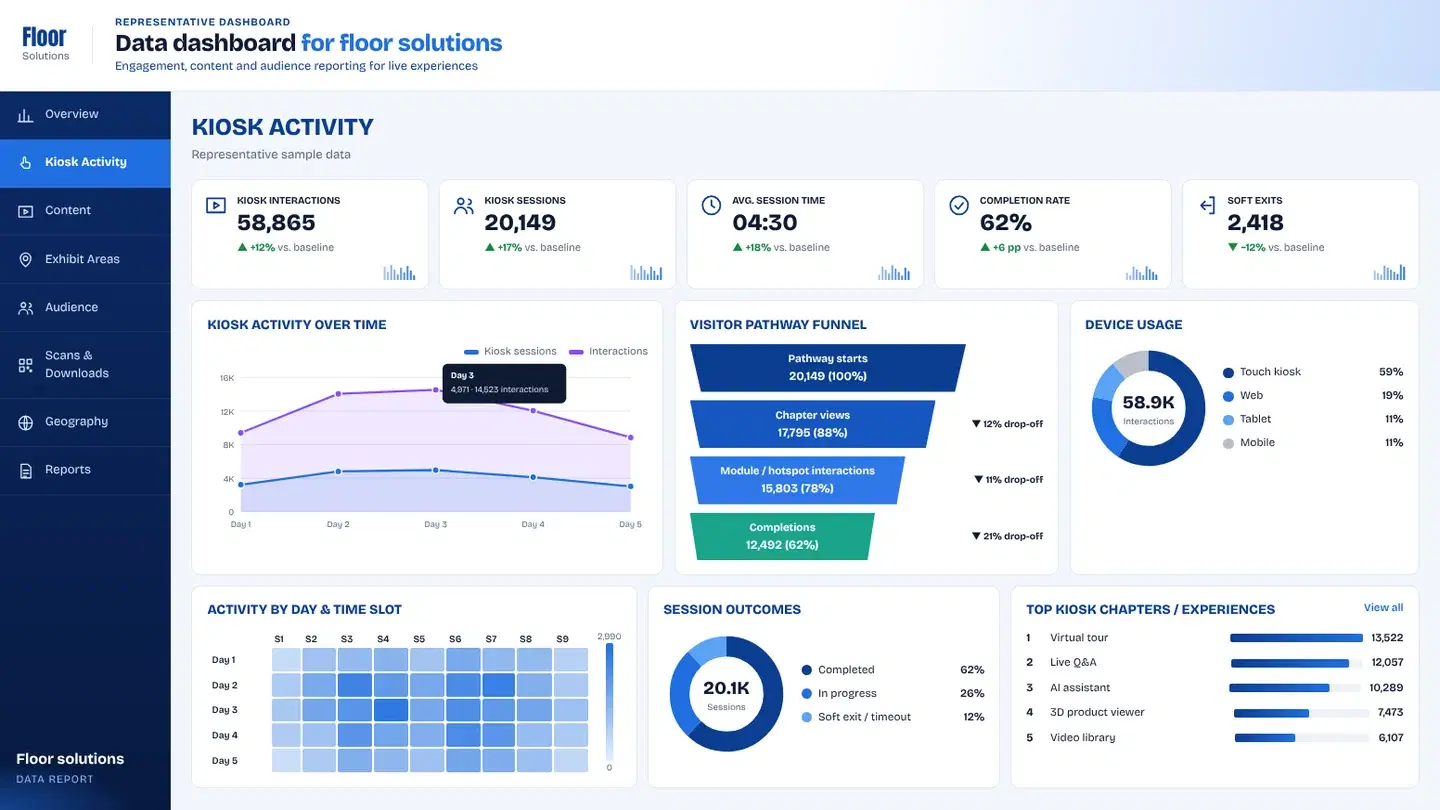
Representation only. This dashboard and its figures are generated sample data that show the kind of reporting I build. No client data, client names or client-related work is used or shared here.
01 The question
An AI kiosk can look busy while hiding what people actually asked — and whether answers helped.
Surface conversation volume, topic themes, voice vs text mix and outcomes for stakeholder review.
AI on the floor is only as useful as the questions you can prove people cared about.
02 What we tagged
I designed topic tagging and outcome states with product and review stakeholders, instrumented the AI kiosk platform, configured GTM with retention-aware scripts, and shaped Looker boards for after the show.
Topic and outcome tags were part of the HIMSS AI kiosk platform — conversations labeled in language marketers and compliance could both accept.
- Conversational AI walk-up kiosk
- Voice and text modalities
- Healthcare product and service topics
- Helpful / end-state outcomes
- 01Conversation start
- 02Voice vs text modality
- 03Topic labels
- 04Duration signals
- 05End / helpful states
- 06Optional rating
03 The pipeline
From a tap on the floor to a chart in the debrief.
Topic and outcome tags were part of the HIMSS AI kiosk platform — conversations labeled in language marketers and compliance could both accept.
04 The dashboard
Studio tabs turn hallway questions into themes leadership can brief on.
- 01Overview
Conversations, modality split and outcome rates.
- 02Topics
What the floor asked for — grouped for product and service owners.
- 03Outcomes
Whether conversations ended usefully, not only that they started.
- 04Reports
Stakeholder packs with evidence for follow-up.
Key takeawayDashboards covered visitors, interactions, top topics, modality split and satisfaction/outcome where collected.
▶ Try the dashboard
Every tap, tagged — explore a working board.
A live demo of the same capture-to-dashboard setup, with sample data instead of client numbers.
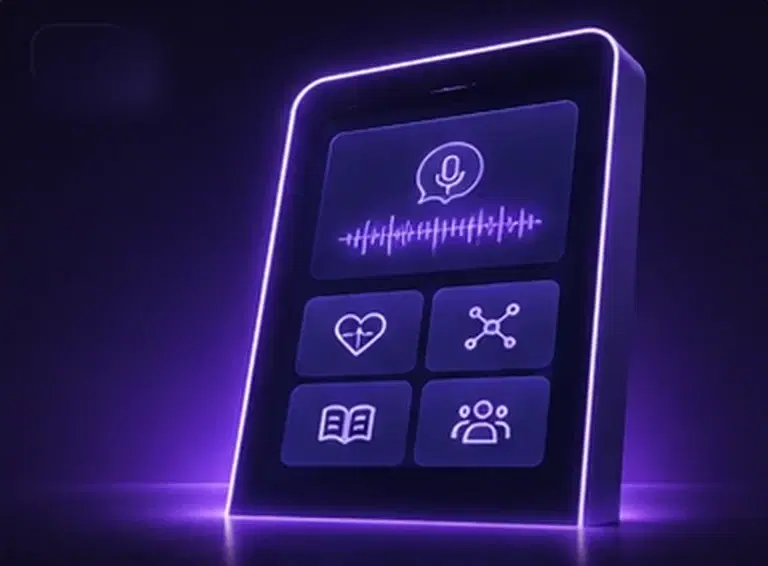 The experience we measuredHIMSS AI Kiosk ExperienceA conversational AI kiosk for healthcare congress — voice and text answers visitors can use without waiting for staff.Read the case study
05 What changed
An AI kiosk can look busy while hiding what people actually asked — and whether answers helped.
- 01
Product and service teams saw which questions dominated the floor, which answers failed, and where to invest demo scripts and content for the next HIMSS cycle.
- Conversations
- Voice vs text
- Top topics
- Outcomes
- Satisfaction
Client confidential — delivered for a brand presenting in this context. The client name is withheld under NDA.
+ Related analytics
Want this level of insight from your next event?