Analytics ISMRM · 2 min read
ISMRM Virtual Sales Analytics
ISMRM 2021 · Virtual Meeting
MR community & ePoster engagement
- Role
- Virtual sales analytics lead
- Context
- ISMRM · 360° virtual sales enabler
- Stack
- 360° Analytics · Google Tag Manager · Hotspots
- Worked with
- Sales enablement, Clinical specialists, Web team
Overview
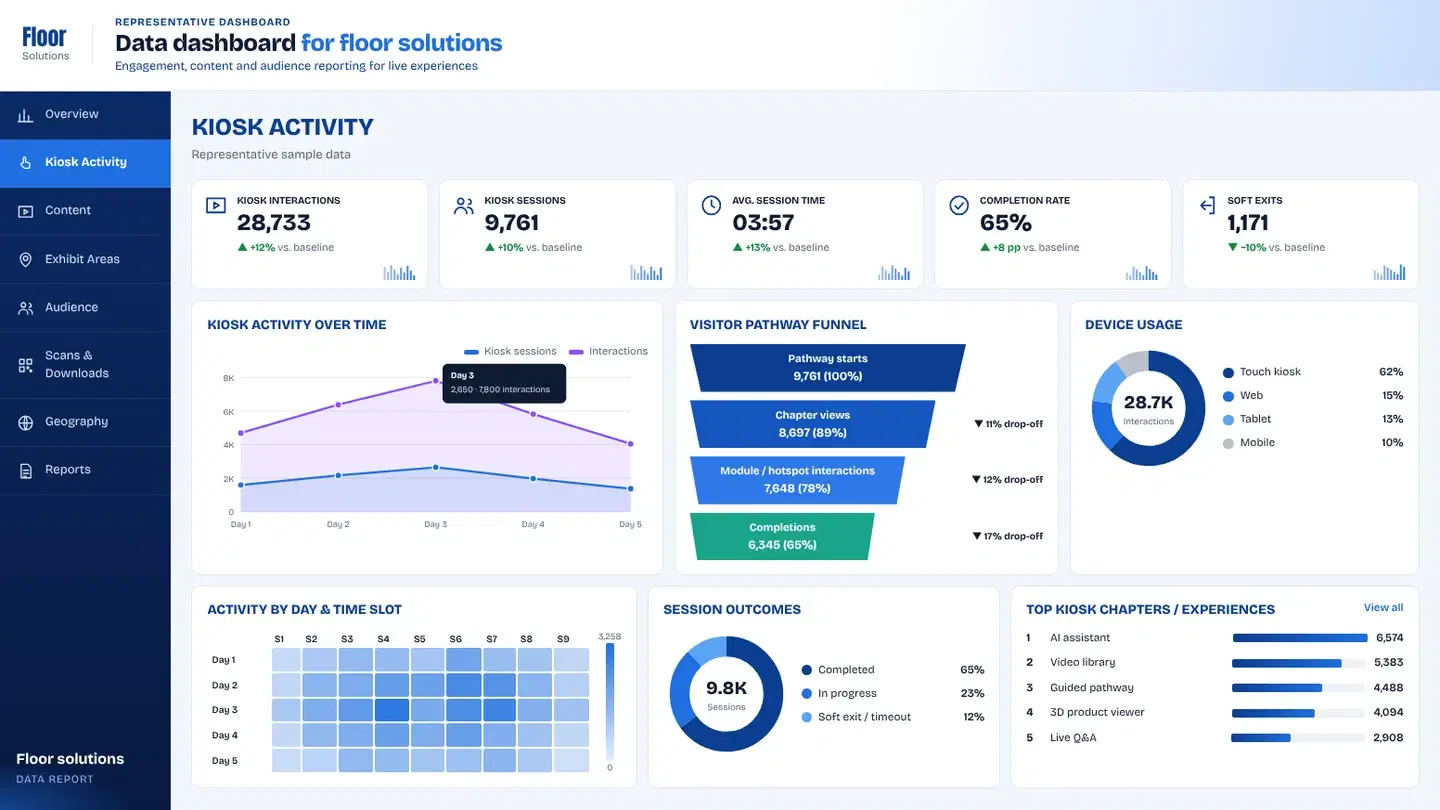
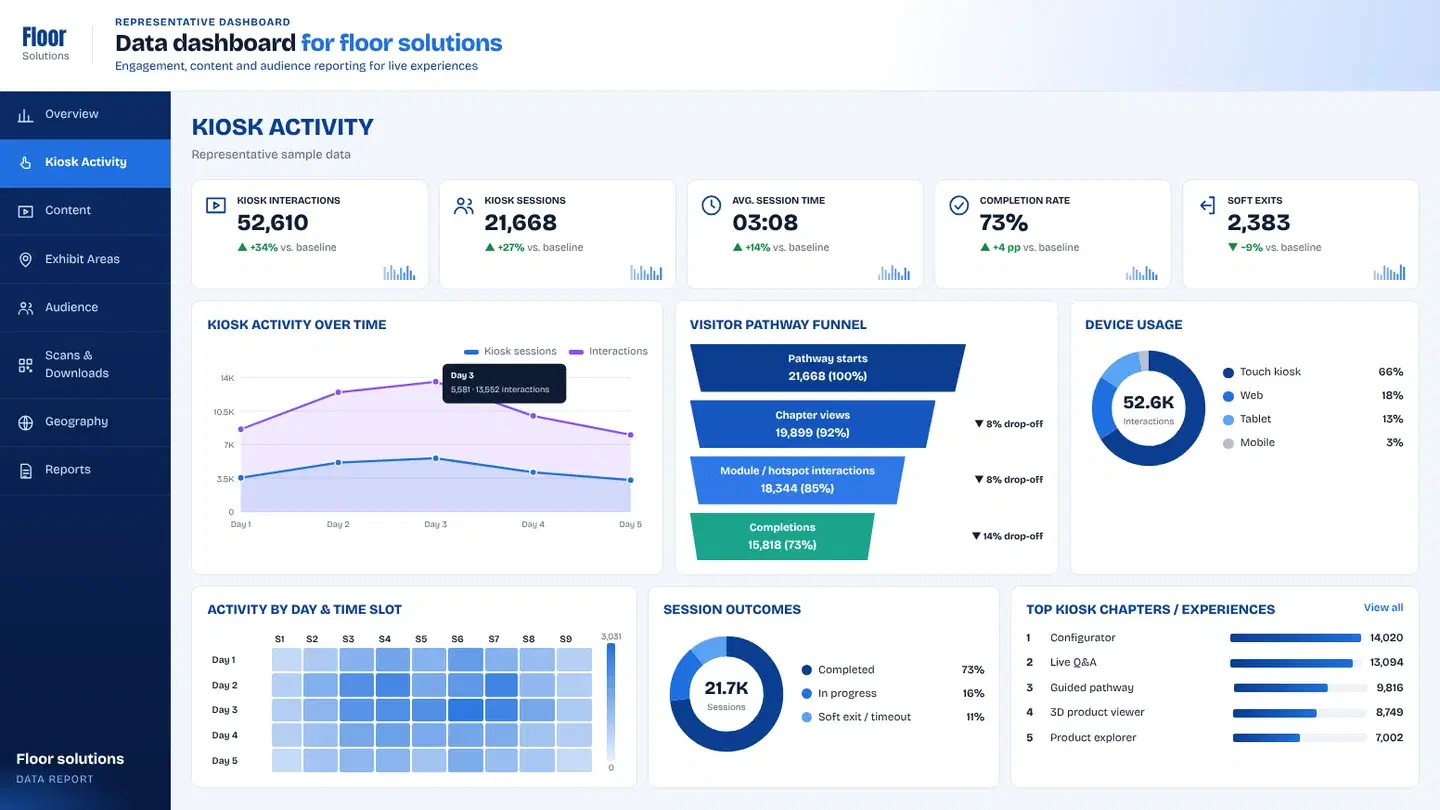
Representative sample data
Unique visitors
6,059▲ +14% vs. baselineSessions
11,848▲ +35% vs. baselineInteractions
26,862▲ +35% vs. baselineAvg. engagement
04:03▲ +21% vs. baselineQualified leads
394▲ +18% vs. baselineEngagement by day
Top experiences
Visitors by region
- North America54%
- Europe21%
- Asia Pacific16%
- Latin America4%
Representation only. This dashboard and its figures are generated sample data that show the kind of reporting I build. No client data, client names or client-related work is used or shared here.
01 The question
The same 360 environment served booth screens and remote calls.
Teams needed one measurement language across both.
Report scene and hotspot engagement for live and remote sales threads without maintaining two analytics stories.
Remote-ready experiences need remote-ready measurement — same truth, different rooms.
02 What we tagged
I unified scene/hotspot taxonomy for booth and remote, instrumented the sales enabler, configured GTM with buffered capture scripts, and delivered shared Looker engagement views.
Scene and hotspot tags were built into the ISMRM virtual sales enabler — the same paths sales enablement used for discovery questions and objection handling.
- 360° virtual sales environment
- MR product and clinical hotspot layers
- Booth screen and remote call contexts
- Sales discovery and objection paths
- 01Environment open
- 02Scene change
- 03Hotspot detail open
- 04Booth vs remote context
- 05Session length / depth
03 The pipeline
From a tap on the floor to a chart in the debrief.
Scene and hotspot tags were built into the ISMRM virtual sales enabler — the same paths sales enablement used for discovery questions and objection handling.
04 The dashboard
Tabs give sales leadership one truth across the aisle and the video call.
- 01Overview
Sessions, depth and context split at a glance.
- 02Scenes & hotspots
Where specialists lingered — glance, read and talk-to-rep layers.
- 03Context
Booth vs remote side-by-side for enablement coaching.
- 04Reports
Sales leadership exports after the meeting.
Key takeawayBoards showed top scenes, detail interest and context split for sales leadership.
▶ Try the dashboard
Every tap, tagged — explore a working board.
A live demo of the same capture-to-dashboard setup, with sample data instead of client numbers.
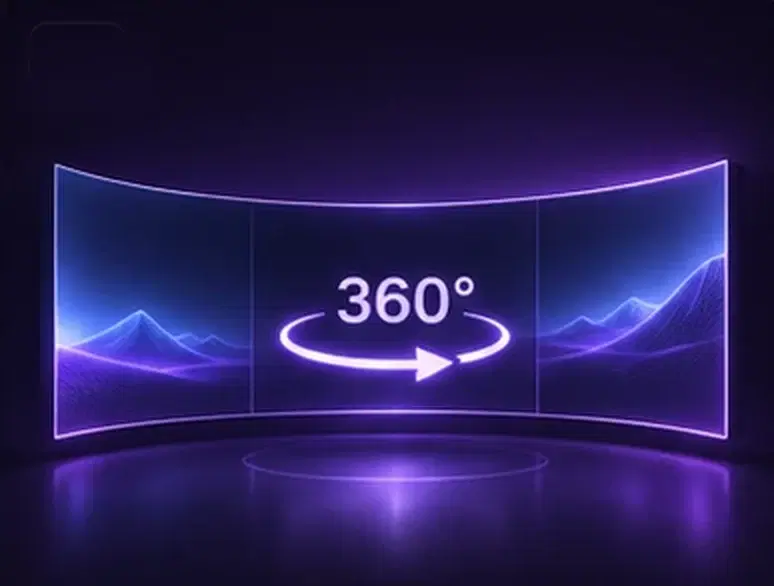 The experience we measuredISMRM 360° Virtual Sales EnablerA 360° virtual sales environment for MR audiences — remote-ready exploration with guided product conversations.Read the case study
05 What changed
The same 360 environment served booth screens and remote calls. Teams needed one measurement language across both.
- 01
Sales enablement coached with evidence — which hotspots closed conversations and which scenes needed deeper clinical content for the next cycle.
- Scene interest
- Hotspot depth
- Booth vs remote
- Session length
- Top details
Client confidential — delivered for a brand presenting in this context. The client name is withheld under NDA.
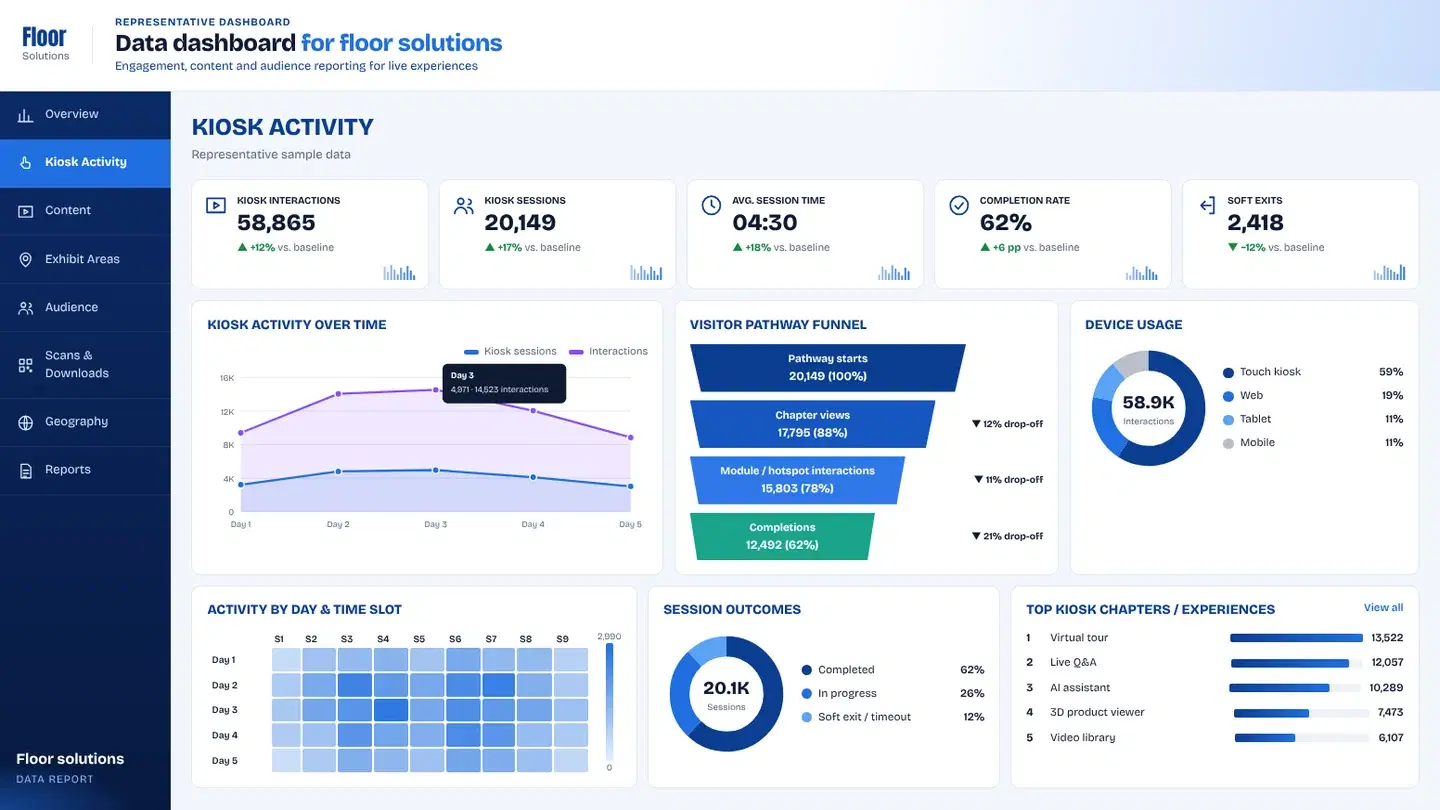
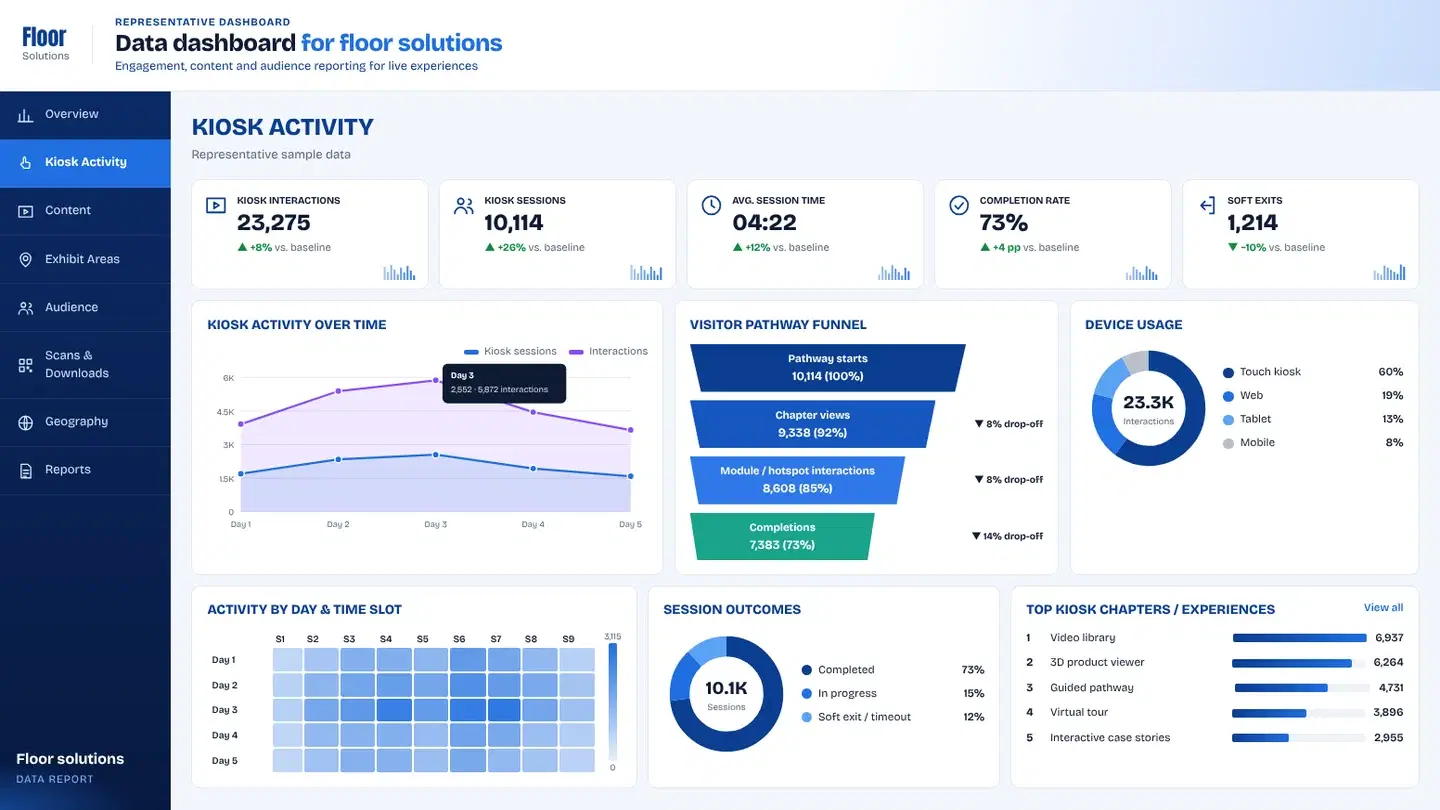
+ Related analytics
Want this level of insight from your next event?