Analytics KCR · 2 min read
KCR Immersive Presentation Analytics
KCR 2023 · Seoul, Korea
Radiology congress engagement
- Role
- Immersive analytics lead
- Context
- KCR · Medical 3D immersive presentation
- Stack
- Immersive Events · Google Tag Manager · Chapter Analytics
- Worked with
- Clinical presenters, Agency, AV partners
Overview
Representative sample data
Unique visitors
6,345▲ +11% vs. baselineSessions
9,761▲ +10% vs. baselineInteractions
28,733▲ +12% vs. baselineAvg. engagement
03:57▲ +13% vs. baselineQualified leads
1,130▲ +16% vs. baselineEngagement by day
Top experiences
Visitors by region
- North America57%
- Europe20%
- Asia Pacific15%
- Latin America5%
Representation only. This dashboard and its figures are generated sample data that show the kind of reporting I build. No client data, client names or client-related work is used or shared here.
01 The question
Expert radiology audiences expect precision.
Immersive presentations needed measurement that respected serious demo flow — not arcade metrics.
Show chapter use, spatial detail opens and demo resets so presenters could refine talk tracks after KCR.
For expert rooms, measurement should feel like clinical feedback — precise, not flashy.
02 What we tagged
I partnered with presenters on chapter events, instrumented the immersive flow, configured GTM, and delivered post-KCR Looker engagement views.
Chapter and detail tags were native to the KCR immersive presentation — named with presenters so the board felt like clinical feedback.
- Medical 3D immersive presentation
- Clinical chapter narratives
- Spatial detail layers
- Live demo and reset flows
- 01Chapter enter
- 02Spatial detail open
- 03Guided demo markers
- 04Reset events
03 The pipeline
From a tap on the floor to a chart in the debrief.
Chapter and detail tags were native to the KCR immersive presentation — named with presenters so the board felt like clinical feedback.
04 The dashboard
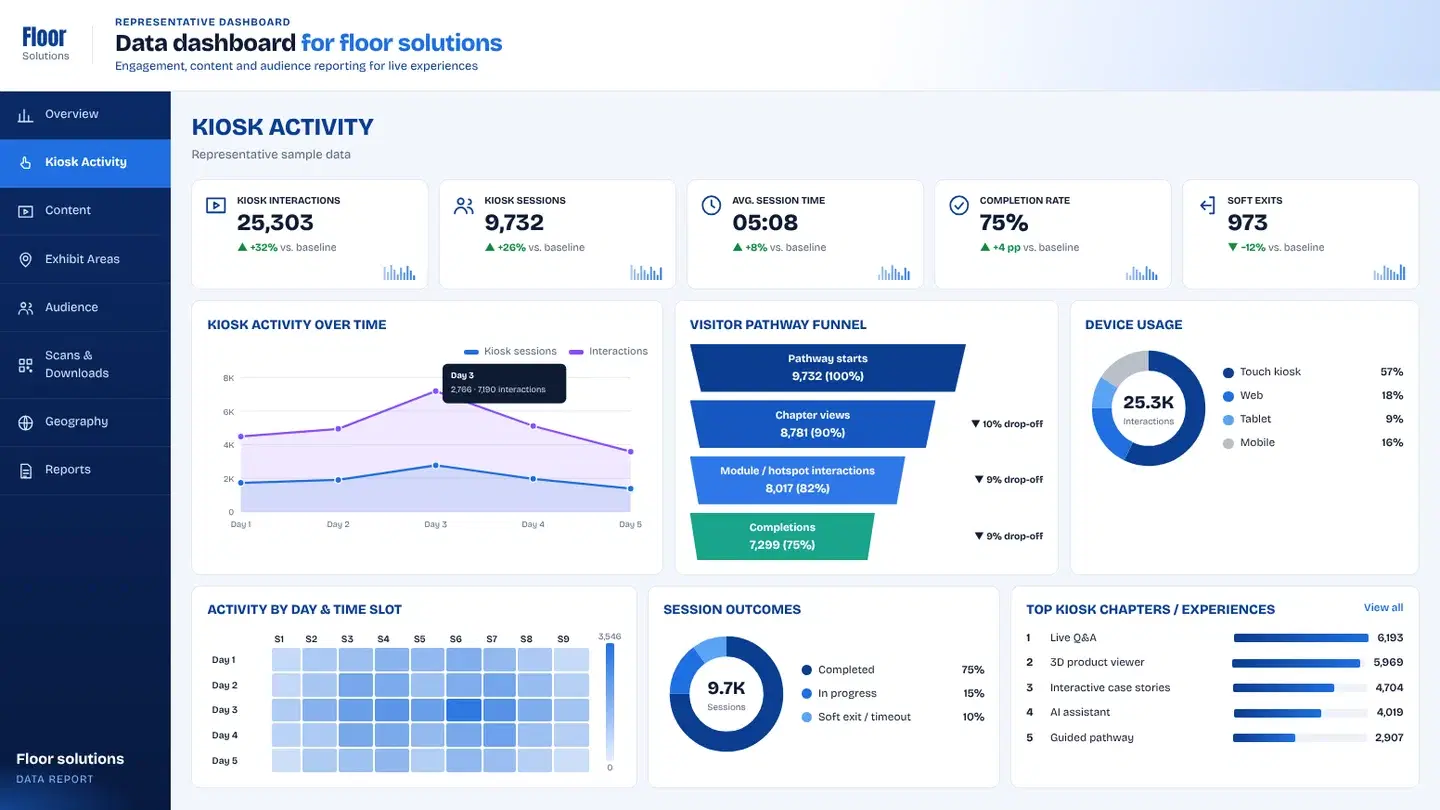
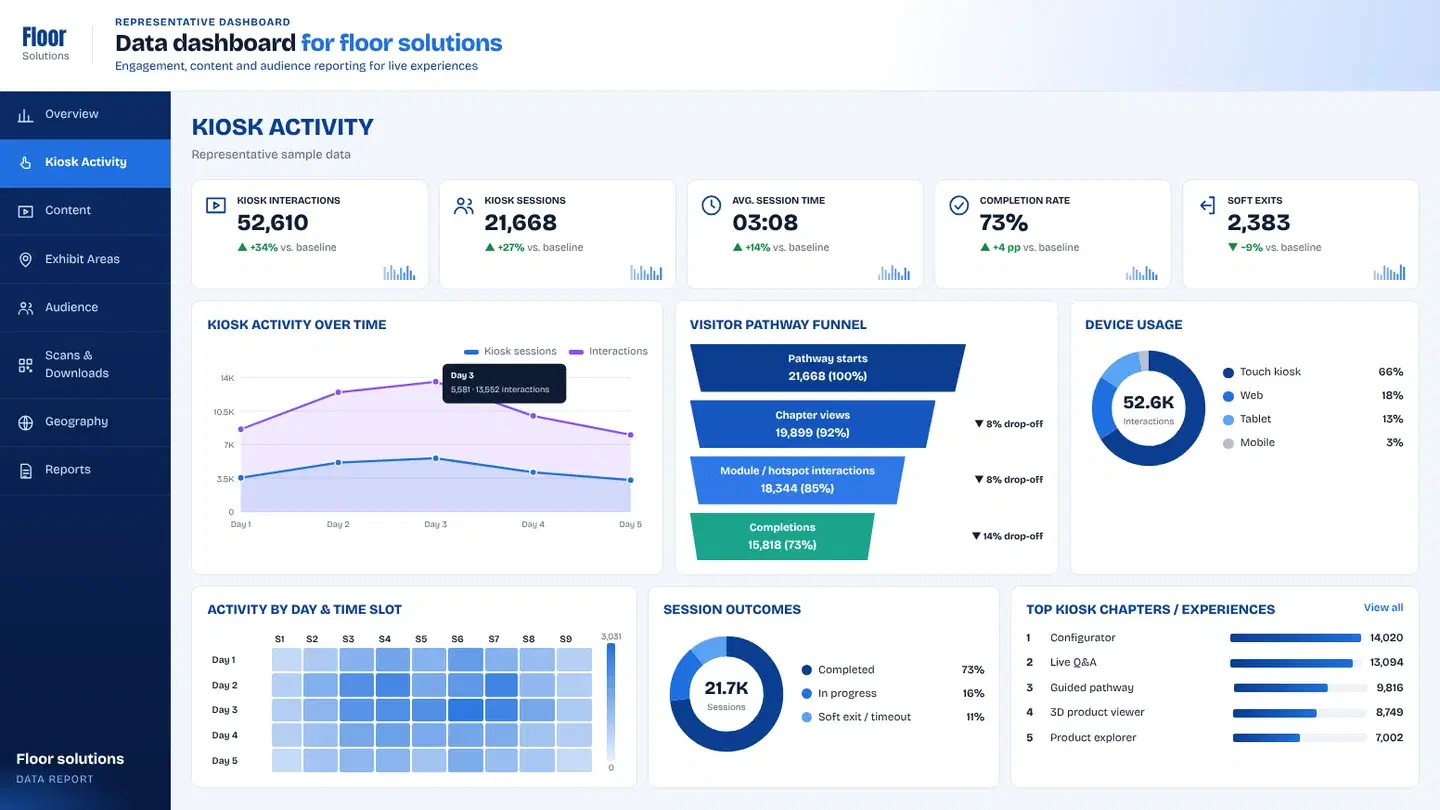
Tabs stay precise — chapter use and detail opens without arcade vanity.
- 01Overview
Demo sessions and chapter interest for the congress.
- 02Chapters
Which immersive chapters carried expert conversations.
- 03Reports
Presenter exports for talk-track refinement.
Key takeawayClear boards for which immersive chapters carried expert conversations.
▶ Try the dashboard
Every tap, tagged — explore a working board.
A live demo of the same capture-to-dashboard setup, with sample data instead of client numbers.
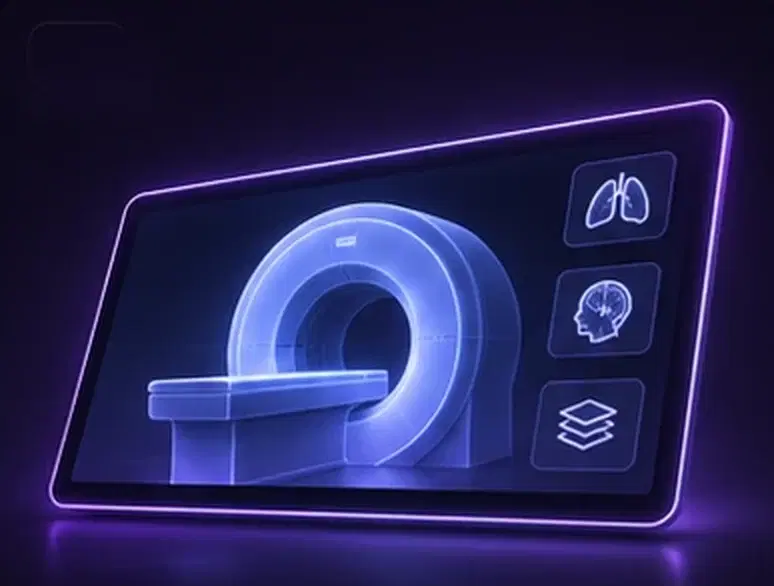 The experience we measuredKCR Medical 3D Immersive PresentationAn immersive medical presentation for Korea’s radiology congress — spatial storytelling for expert audiences.Read the case study
05 What changed
Expert radiology audiences expect precision. Immersive presentations needed measurement that respected serious demo flow — not arcade metrics.
- 01
Presenters adjusted default chapters and talk tracks using real session evidence — product and clinical stories that earned depth stayed; noise went.
- Chapter use
- Detail opens
- Demo sessions
- Resets
- Top chapters
Client confidential — delivered for a brand presenting in this context. The client name is withheld under NDA.
+ Related analytics
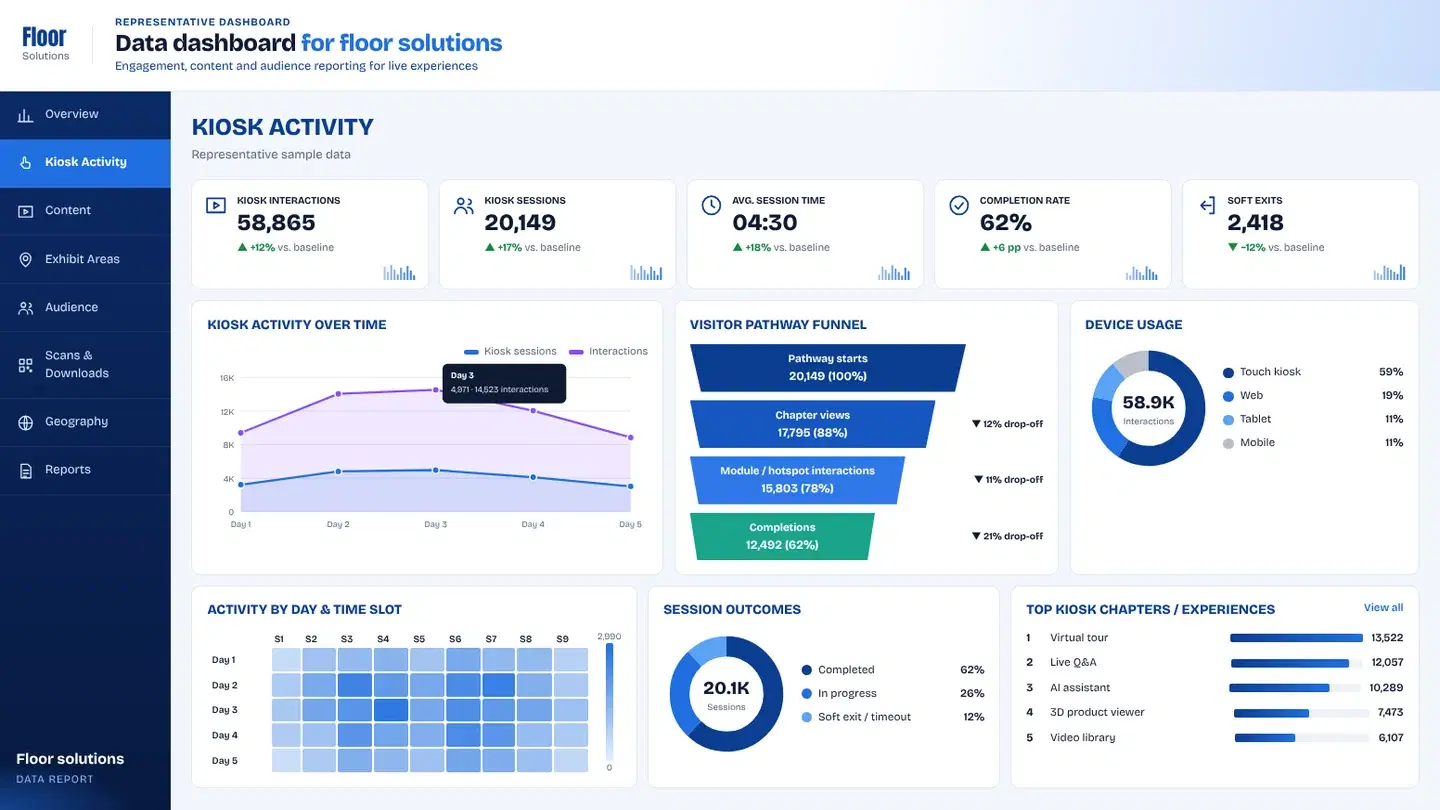
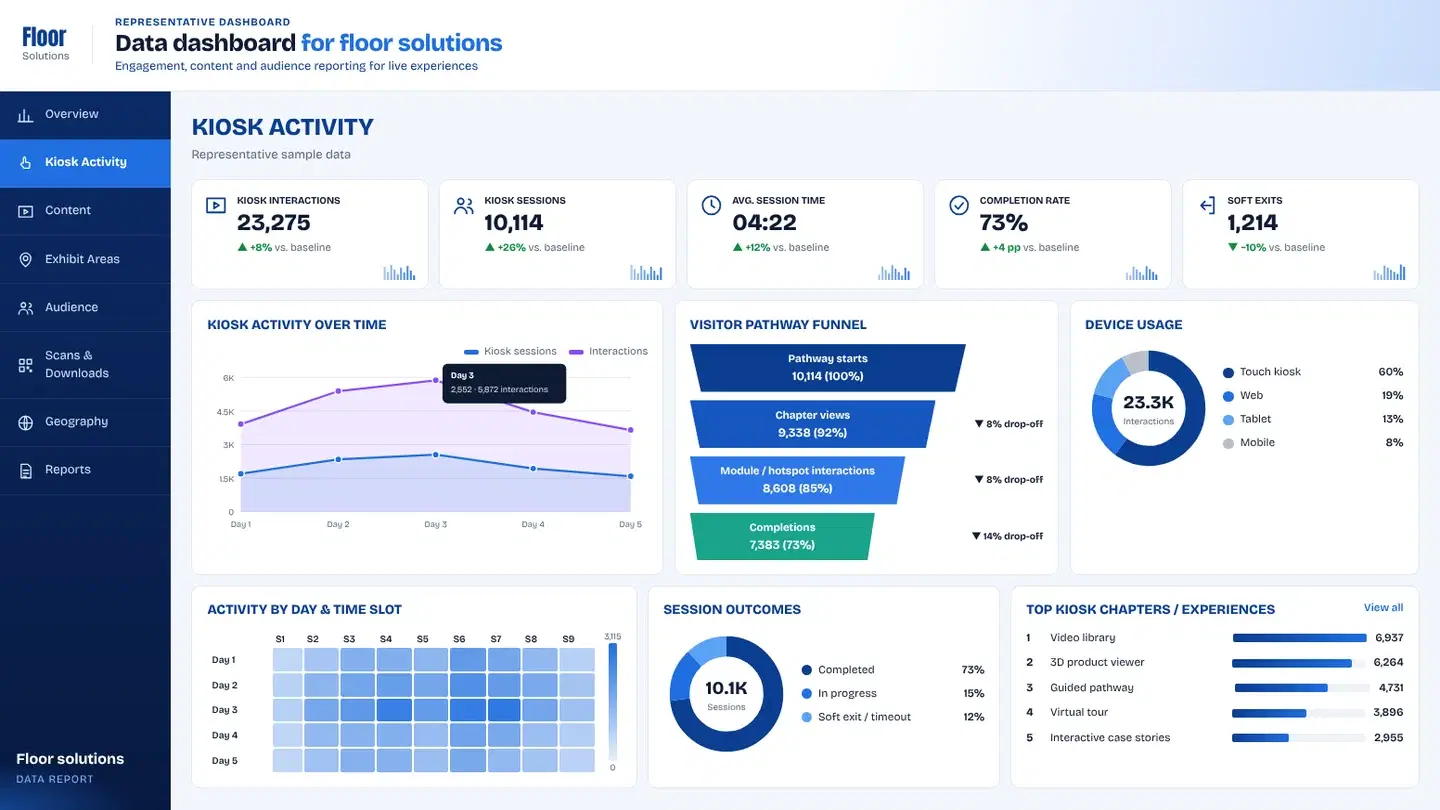
Want this level of insight from your next event?