Analytics Live Q&A · 2 min read
Live Q&A Participation Analytics
Engage · Participate · Learn · Compete
Questions, scores and live participation
- Role
- Participation analytics lead
- Context
- Live audience Q&A / engagement layer
- Stack
- Realtime Capture · Google Tag Manager · Participation KPIs
- Worked with
- Producers, Moderators, Education stakeholders
Overview
Representative sample data
Unique visitors
5,989▲ +25% vs. baselineSessions
15,367▲ +29% vs. baselineInteractions
36,368▲ +20% vs. baselineAvg. engagement
04:50▲ +17% vs. baselineQualified leads
876▲ +12% vs. baselineEngagement by day
Top experiences
Visitors by region
- North America46%
- Europe24%
- Asia Pacific18%
- Latin America7%
Representation only. This dashboard and its figures are generated sample data that show the kind of reporting I build. No client data, client names or client-related work is used or shared here.
01 The question
Live formats generate energy that disappears unless participation is captured with clean session rules.
Report questions, unique participants, timing and engagement quality after each session.
If you cannot report participation calmly, you cannot improve the next session.
02 What we tagged
I defined participation KPIs with producers, instrumented the live layer with GTM and realtime scripts, and delivered Looker session summaries for education teams.
Participation tags sit in the live engagement layer — same KPI names whether the room is education, product or competing format.
- Live audience Q&A layer
- Question and interaction flows
- Multi-room comparable sessions
- Programme timing alignment
- 01Join
- 02Question
- 03Vote / interact
- 04Session boundary
03 The pipeline
From a tap on the floor to a chart in the debrief.
Participation tags sit in the live engagement layer — same KPI names whether the room is education, product or competing format.
04 The dashboard
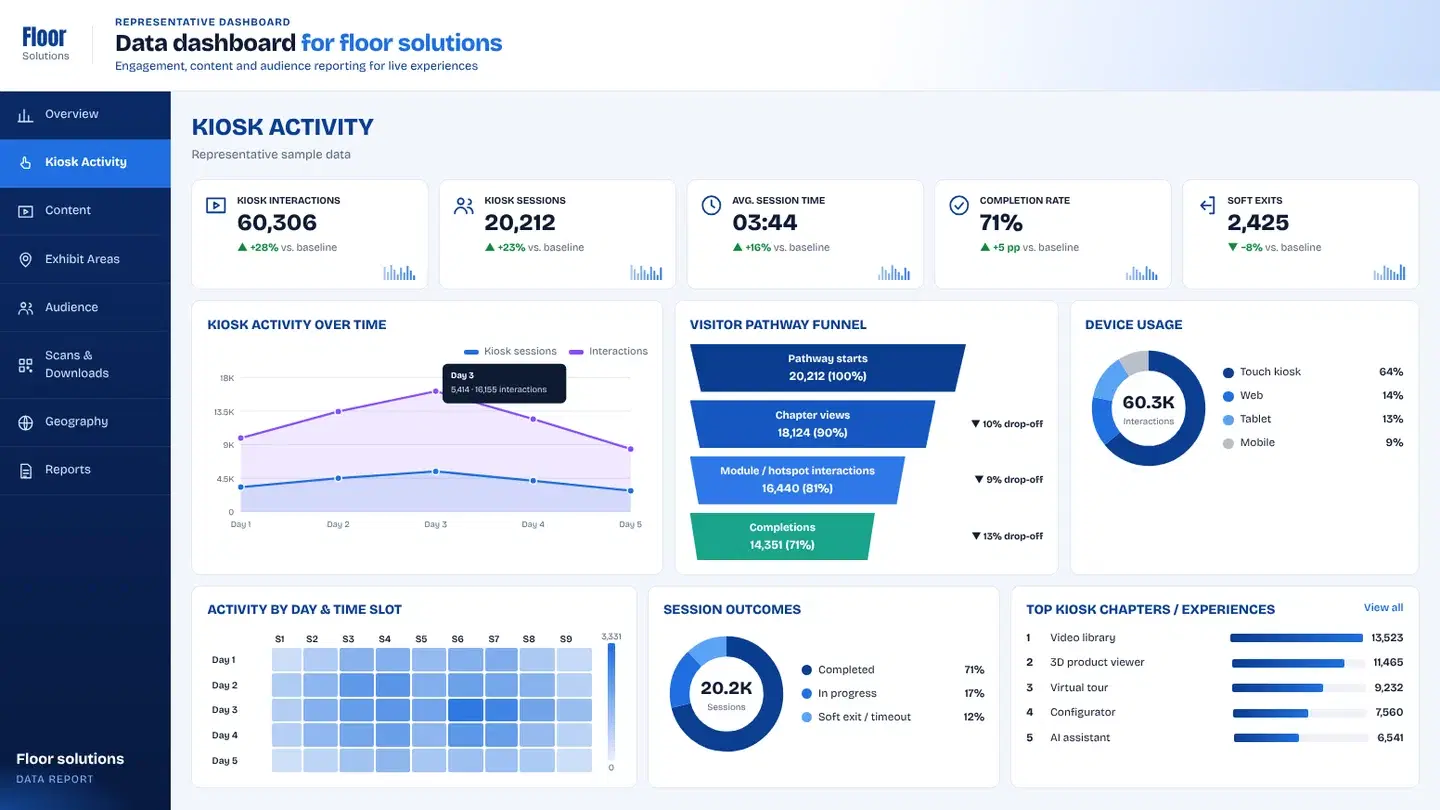
Tabs make participation calm and comparable across rooms.
- 01Overview
Participants, questions and peaks against the agenda.
- 02Sessions
Room-by-room cards with shared definitions.
- 03Reports
Education exports after each programme block.
Key takeawayClear boards for volume, uniqueness, timing and peaks against the agenda.
▶ Try the dashboard
Every tap, tagged — explore a working board.
A live demo of the same capture-to-dashboard setup, with sample data instead of client numbers.
05 What changed
Live formats generate energy that disappears unless participation is captured with clean session rules.
- 01
Programme teams improved the next session — length, prompts and format — using participation proof, not room feel alone.
- Participants
- Questions
- Interactions
- Peaks
- Session compare
Client confidential — delivered for a brand presenting in this context. The client name is withheld under NDA.
+ Related analytics
Want this level of insight from your next event?