Analytics HCE · 2 min read
HCE Showcase Analytics
HCE 2023 · Paris, France
Healthcare meetings & visitor profiles
- Role
- Measurement lead
- Context
- HCE Paris · Self-guided healthcare showcase
- Stack
- Localized Tagging · Google Tag Manager · Kiosk Analytics
- Worked with
- Local brand team, Booth fabricator, Agency
Overview
Representative sample data
Unique visitors
3,202▲ +27% vs. baselineSessions
19,101▲ +35% vs. baselineInteractions
53,952▲ +16% vs. baselineAvg. engagement
05:20▲ +13% vs. baselineQualified leads
644▲ +24% vs. baselineEngagement by day
Top experiences
Visitors by region
- North America51%
- Europe25%
- Asia Pacific15%
- Latin America7%
Representation only. This dashboard and its figures are generated sample data that show the kind of reporting I build. No client data, client names or client-related work is used or shared here.
01 The question
A professional French healthcare floor needed polished unattended exploration — and proof of which sections professionals actually opened.
Deliver section-level engagement views the local team could share after the salon.
Measurement travels better when it respects the local room — language, tone and buying culture.
02 What we tagged
I set section taxonomy with the local team, instrumented the kiosk platform, configured GTM, and packaged post-salon Looker views.
Section tags were native to the HCE showcase build — labels written for local reporting, not translated engineering names.
- Self-guided healthcare showcase sections
- Localized product and service stories
- Professional walk-up exploration
- 01Section open
- 02Content depth
- 03Completion / exit
03 The pipeline
From a tap on the floor to a chart in the debrief.
Section tags were native to the HCE showcase build — labels written for local reporting, not translated engineering names.
04 The dashboard
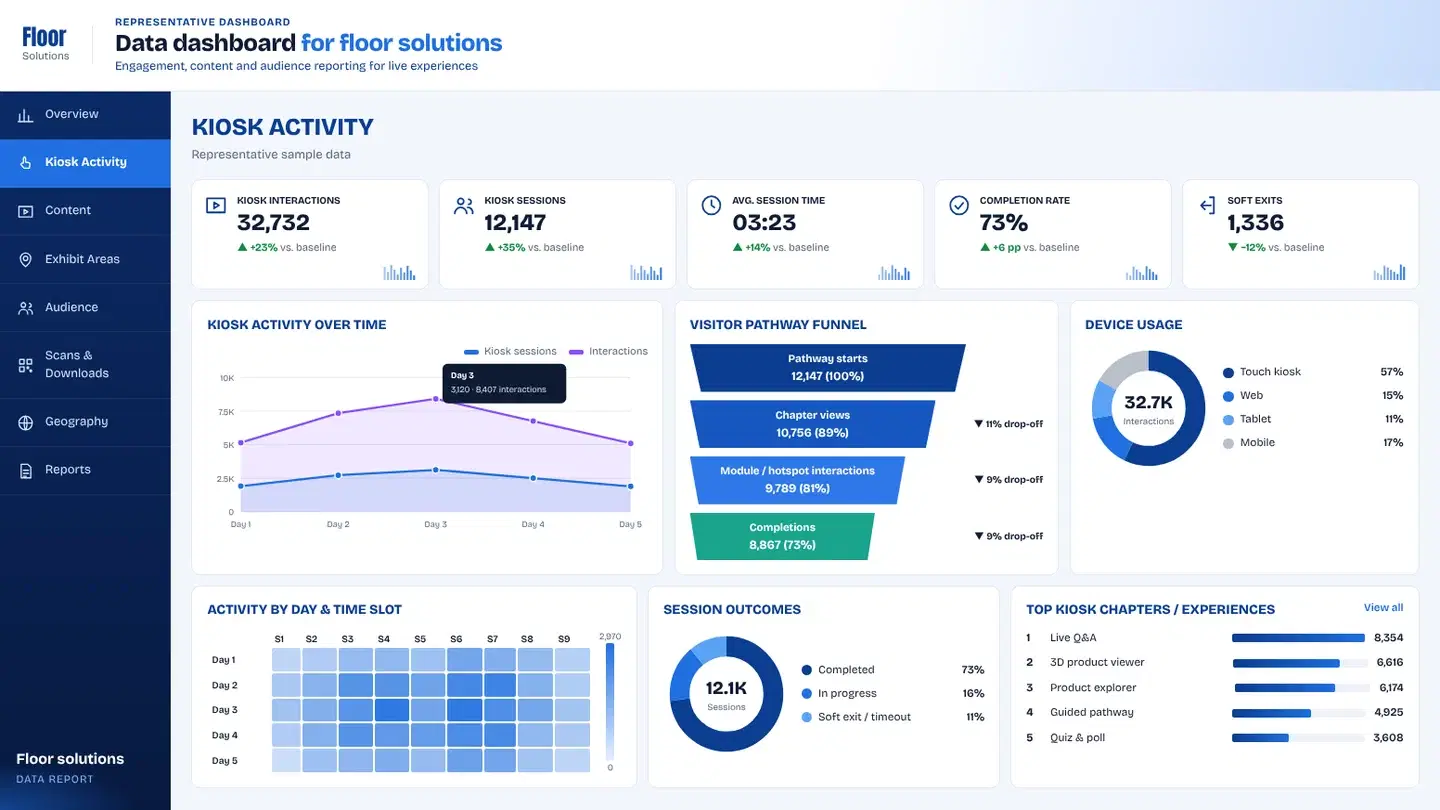
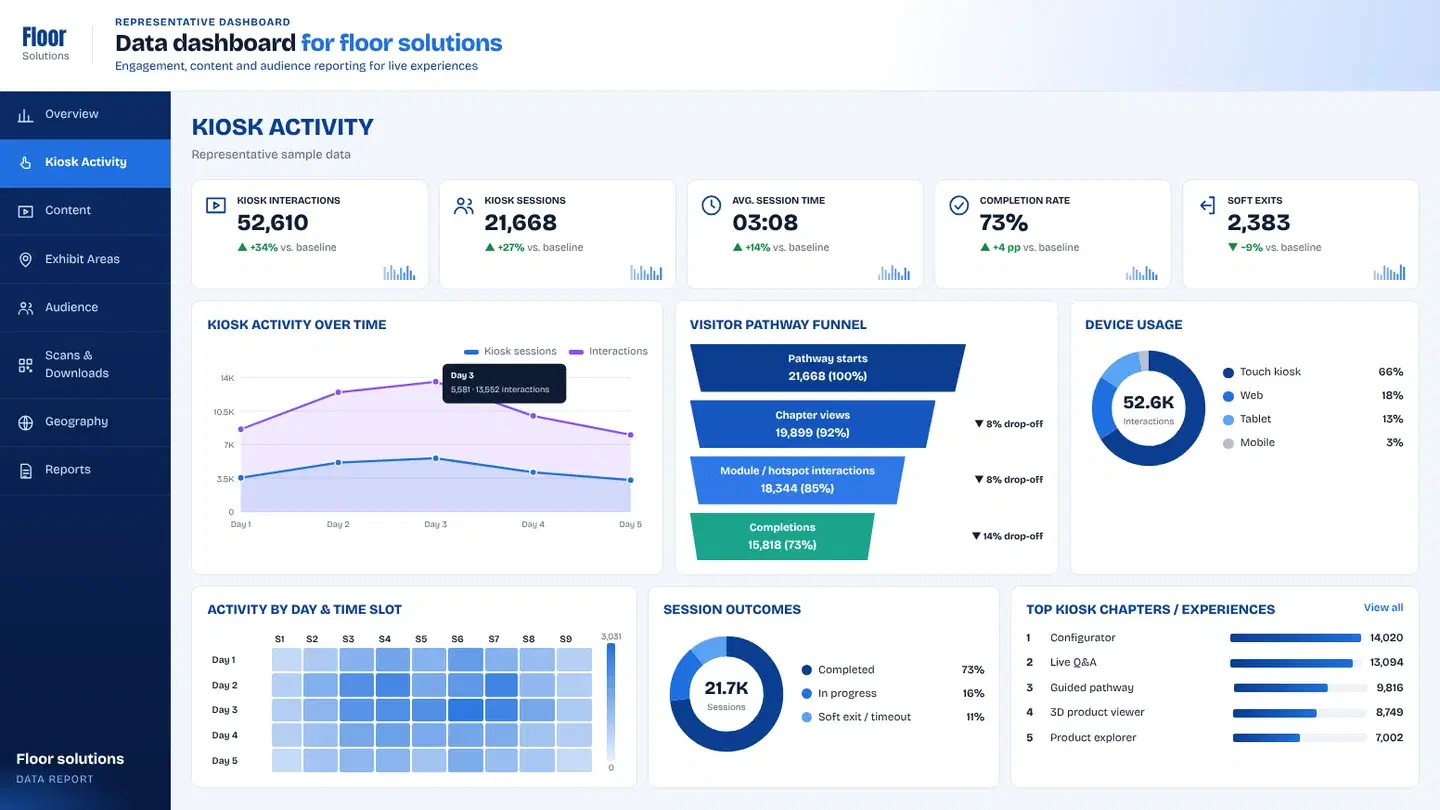
Tabs keep the salon debrief professional — section interest, depth and day patterns.
- 01Overview
Visitor depth and completion for the salon window.
- 02Sections
Which professional stories opened most.
- 03Reports
Local stakeholder exports after close.
Key takeawaySection interest, visitor depth and day-by-day traffic for salon follow-up.
▶ Try the dashboard
Every tap, tagged — explore a working board.
A live demo of the same capture-to-dashboard setup, with sample data instead of client numbers.
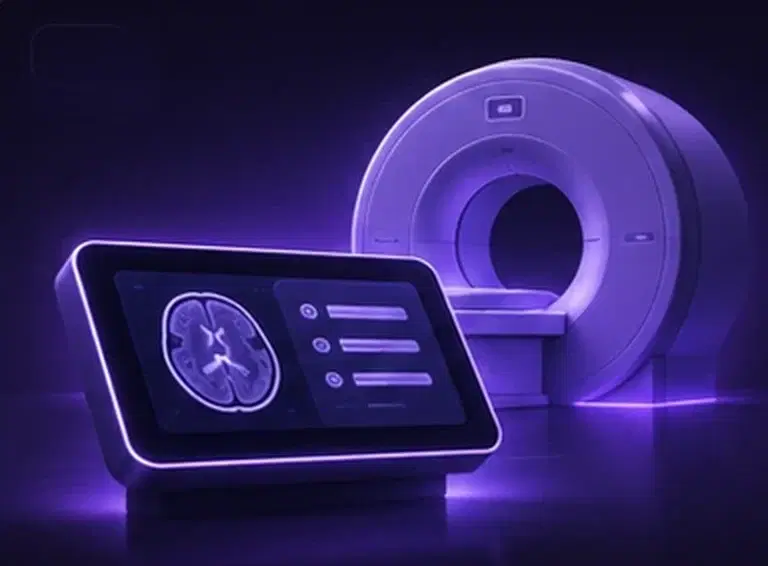 The experience we measuredHCE Self-Guided Product ShowcaseA French healthcare expo showcase designed for unattended exploration and professional visitor flow.Read the case study
05 What changed
A professional French healthcare floor needed polished unattended exploration — and proof of which sections professionals actually opened.
- 01
Local stakeholders mapped professional interest across products and services — then briefed follow-ups with section-level proof.
- Section opens
- Depth
- Completions
- Day patterns
- Top sections
Client confidential — delivered for a brand presenting in this context. The client name is withheld under NDA.
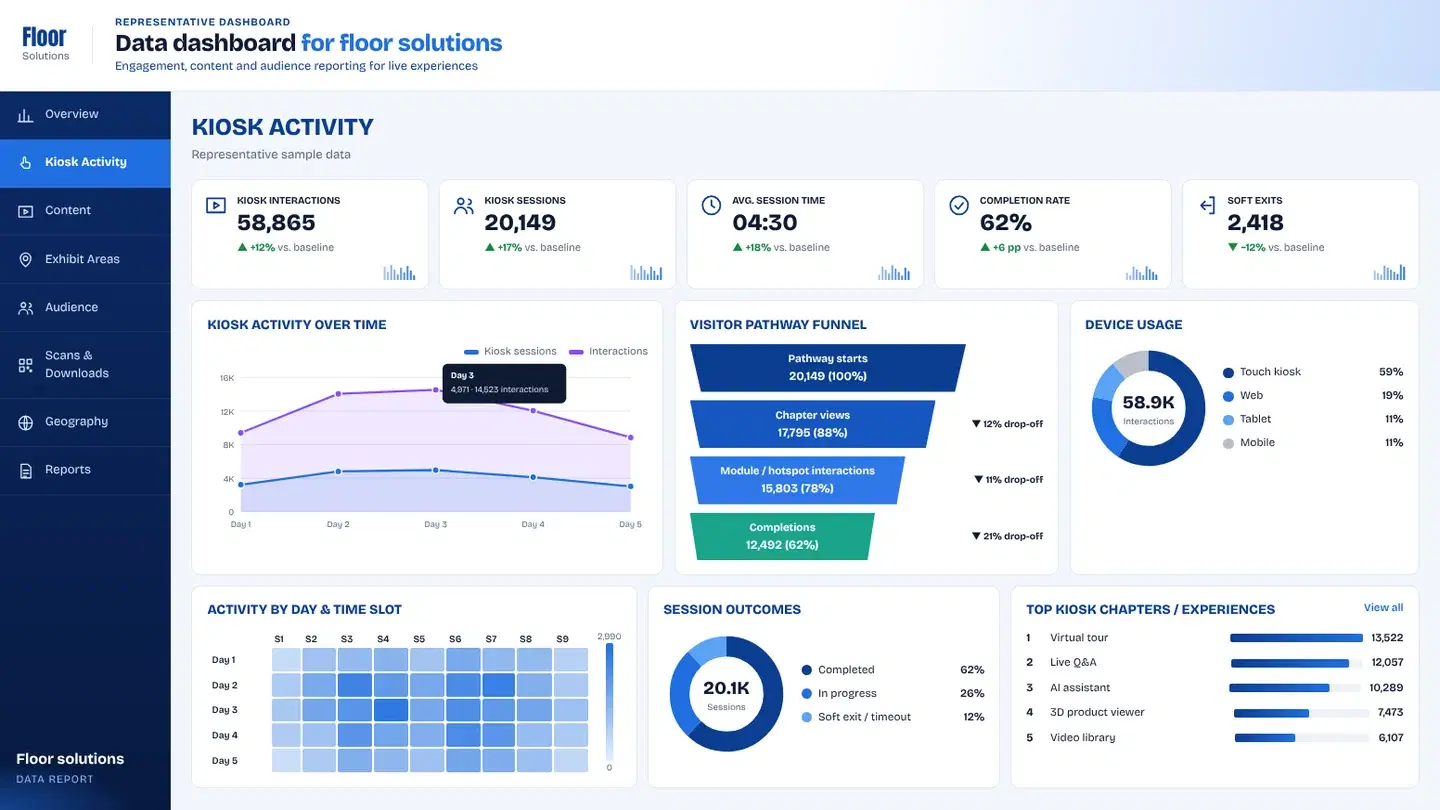
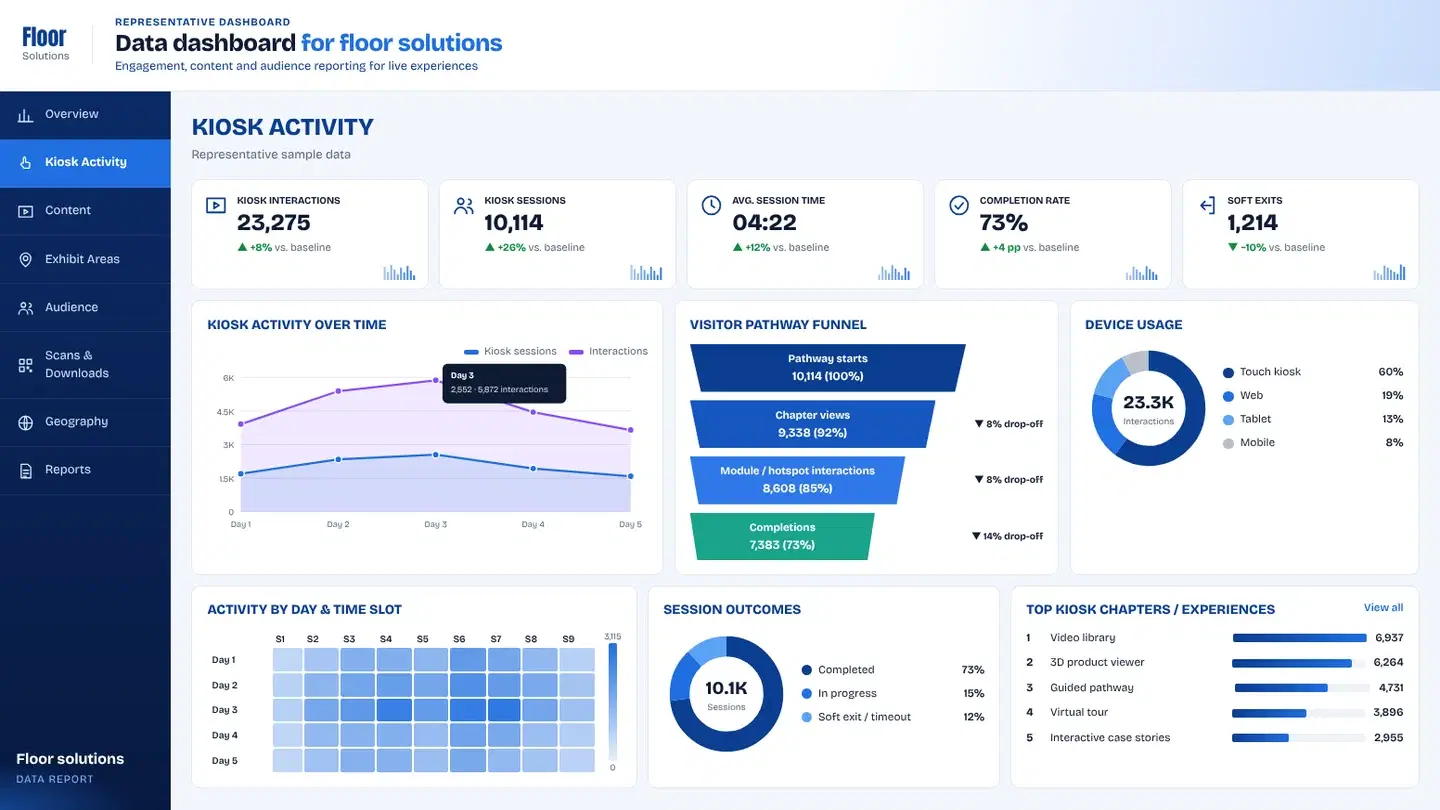
+ Related analytics
Want this level of insight from your next event?