Analytics Virtual Tour · 2 min read
Virtual Tour Platform Analytics
360° Experience · Hotspot Engagement
Scene depth, hotspots and tour completion
- Role
- Platform analytics lead
- Context
- Cross-show · Reusable virtual tour system
- Stack
- Reusable Taxonomy · Google Tag Manager · Tour Funnels
- Worked with
- Account leads, Content strategists, Client analytics
Overview
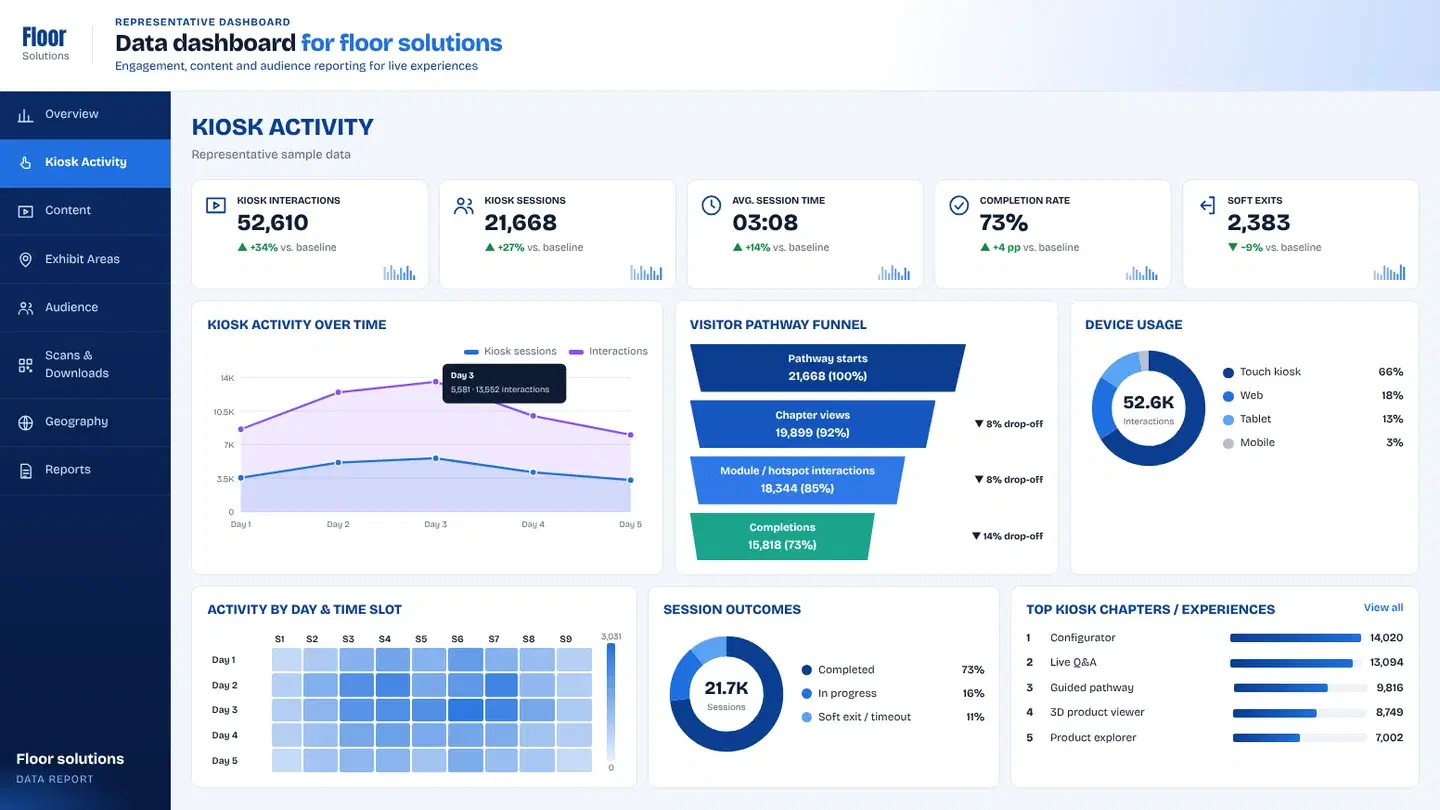
Representative sample data
Unique visitors
3,377▲ +35% vs. baselineSessions
9,732▲ +26% vs. baselineInteractions
25,303▲ +32% vs. baselineAvg. engagement
05:08▲ +8% vs. baselineQualified leads
801▲ +20% vs. baselineEngagement by day
Top experiences
Visitors by region
- North America56%
- Europe18%
- Asia Pacific14%
- Latin America8%
Representation only. This dashboard and its figures are generated sample data that show the kind of reporting I build. No client data, client names or client-related work is used or shared here.
01 The question
Many brands needed tours that could be reskinned without inventing a new measurement model every time.
Establish a reusable capture and reporting pattern — starts, depth, hotspots, completions — comparable across shows.
Platforms win when analytics is part of the product — not a rebuild every show.
02 What we tagged
I designed the shared hotspot/scene taxonomy, GTM instrumentation pattern and Looker templates used across tour deployments.
Shared scene/hotspot tags are part of the virtual tour platform itself — new brands inherit the taxonomy instead of inventing tags two nights before open.
- Reusable 360° tour framework
- Scene templates and hotspot classes
- Cross-show comparable KPIs
- Brand-reskinned experiences on one measurement model
- 01Tour start
- 02Scene enter
- 03Hotspot open
- 04Media engage
- 05Completion
03 The pipeline
From a tap on the floor to a chart in the debrief.
Shared scene/hotspot tags are part of the virtual tour platform itself — new brands inherit the taxonomy instead of inventing tags two nights before open.
04 The dashboard
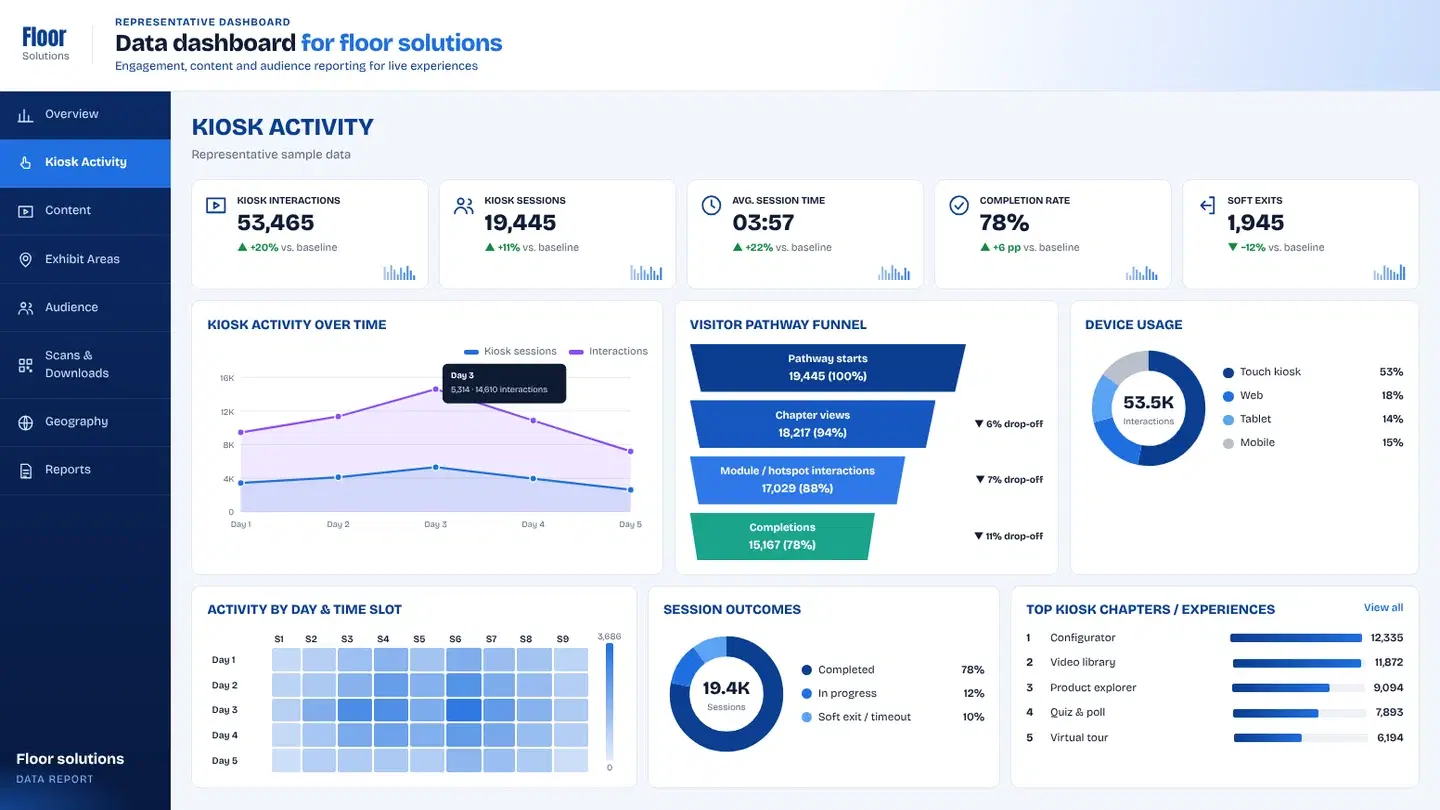
Template tabs make every tour debrief comparable — starts, depth, hotspots, completions.
- 01Overview
Starts, depth and completions for the deployment.
- 02Scenes & hotspots
Interest maps content owners can act on.
- 03Cross-show
Portfolio compare when leadership asks for honesty across events.
- 04Reports
Reusable export packs for account teams.
Key takeawayComparable funnels and hotspot boards across congress and exhibition tours.
▶ Try the dashboard
Every tap, tagged — explore a working board.
A live demo of the same capture-to-dashboard setup, with sample data instead of client numbers.
 The experience we measuredVirtual Tour Platform ExperienceA reusable virtual tour system for exhibitions — scene navigation, hotspot layers and visitor journey measurement.Read the case study
05 What changed
Many brands needed tours that could be reskinned without inventing a new measurement model every time.
- 01
Teams published faster and reviewed tours on one measurement vocabulary — deciding which scenes to reuse, retire or deepen across the portfolio.
- Starts
- Depth
- Hotspots
- Completions
- Cross-show compare
Client confidential — delivered for a brand presenting in this context. The client name is withheld under NDA.
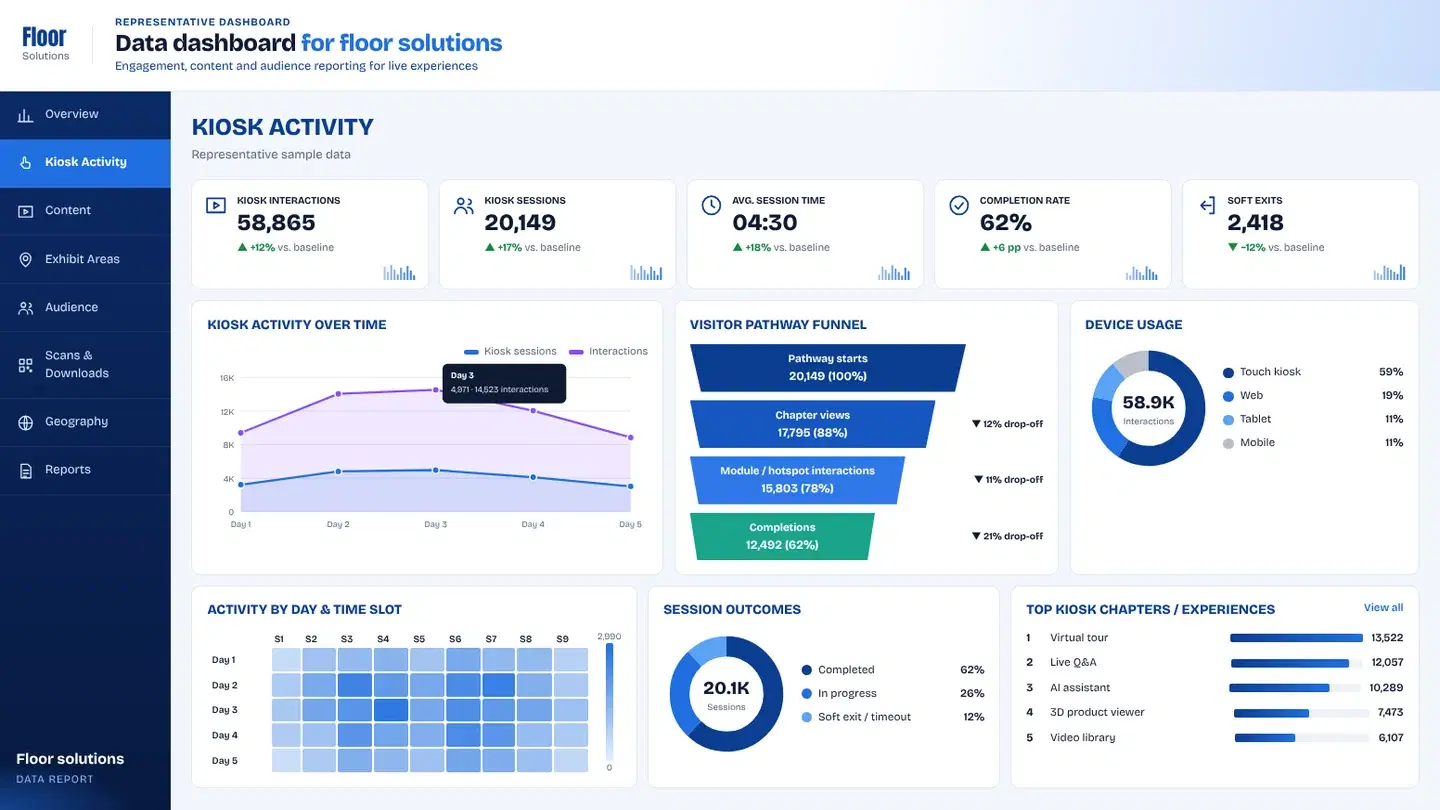
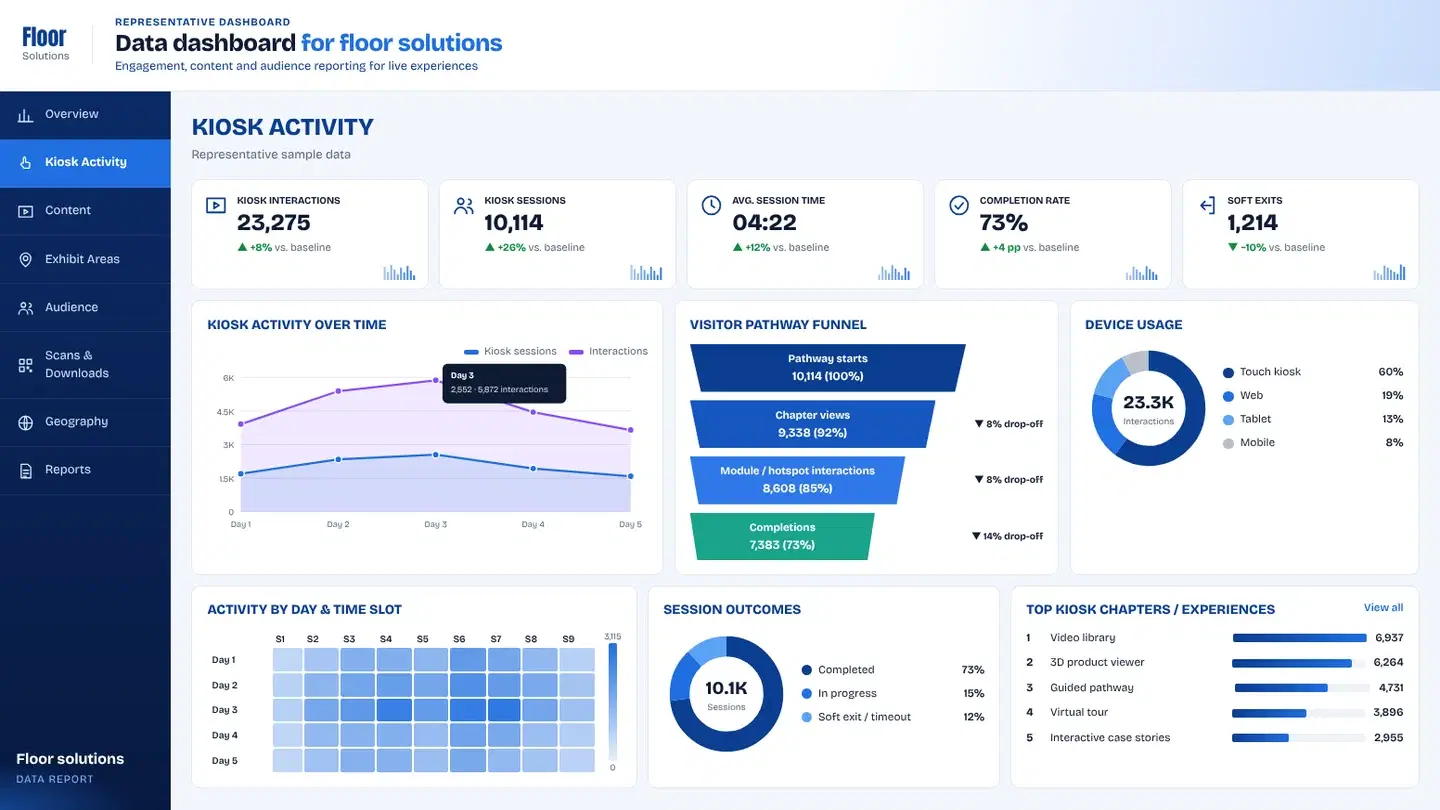
+ Related analytics
Want this level of insight from your next event?