Analytics ESC · 2 min read
ESC Dynamic Presentation Analytics
ESC Congress 2021 · Digital Experience
Virtual congress engagement
- Role
- Presentation analytics lead
- Context
- ESC · Dynamic branching presentation
- Stack
- Module Tagging · Google Tag Manager · Looker Studio
- Worked with
- Cardiology brand team, Digital producers, Agency
Overview
Representative sample data
Unique visitors
9,248▲ +8% vs. baselineSessions
21,761▲ +29% vs. baselineInteractions
56,770▲ +10% vs. baselineAvg. engagement
03:58▲ +10% vs. baselineQualified leads
939▲ +24% vs. baselineEngagement by day
Top experiences
Visitors by region
- North America60%
- Europe21%
- Asia Pacific14%
- Latin America3%
Representation only. This dashboard and its figures are generated sample data that show the kind of reporting I build. No client data, client names or client-related work is used or shared here.
01 The question
Digital and booth contexts both used branching stories.
Without shared measurement, nobody knew which branches carried the congress.
Unify engagement views across digital and floor presentations — modules used, paths taken, attention earned.
Branching without measurement just multiplies uncertainty.
02 What we tagged
I aligned taxonomy across contexts, instrumented the presentation system, configured GTM, and delivered Looker boards the brand team could use after ESC.
Branch and module tags were native to the ESC dynamic presentation platform — one schema for booth hardware and digital congress windows.
- Dynamic branching cardiology presentations
- Booth and digital module stories
- Feature and outcome paths
- Guided vs self-serve modes
- 01Module opens
- 02Branch choices
- 03Returns / revisits
- 04Session boundaries
- 05Context (booth vs digital)
03 The pipeline
From a tap on the floor to a chart in the debrief.
Branch and module tags were native to the ESC dynamic presentation platform — one schema for booth hardware and digital congress windows.
04 The dashboard
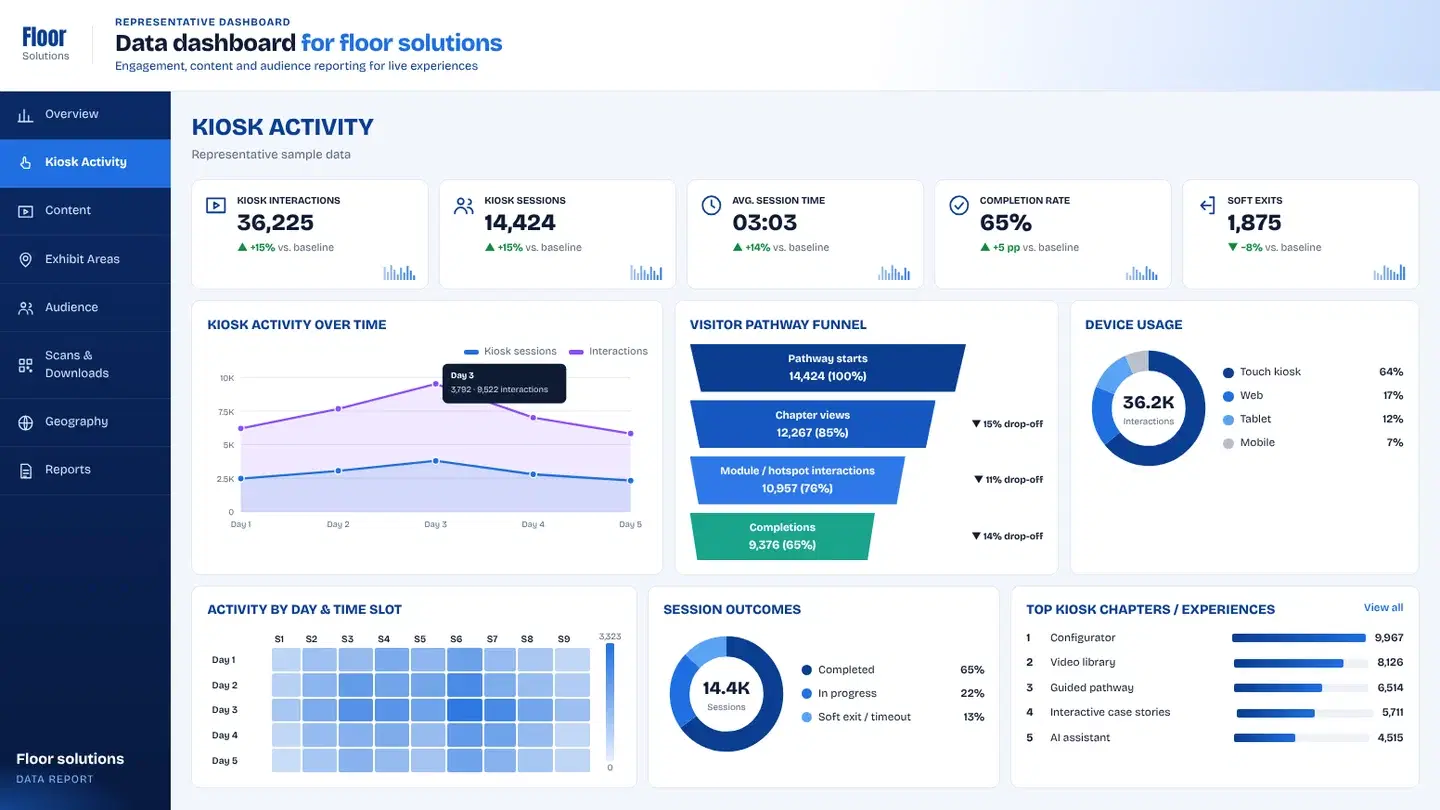
Tabs compare the same story across contexts — so brand teams do not maintain two analytics narratives.
- 01Overview
Module interest and engagement across the congress window.
- 02Branches
Which story paths were taken — and which never opened.
- 03Context split
Booth vs digital side-by-side with shared definitions.
- 04Reports
Planning exports for the next cardiology cycle.
Key takeawayLooker views compared module interest, unused branches and daily patterns across the congress window.
▶ Try the dashboard
Every tap, tagged — explore a working board.
A live demo of the same capture-to-dashboard setup, with sample data instead of client numbers.
 The experience we measuredESC Dynamic Presentation SystemA flexible presentation system for cardiology congress — built for live demos, branching stories and short attention windows.Read the case study
05 What changed
Digital and booth contexts both used branching stories. Without shared measurement, nobody knew which branches carried the congress.
- 01
Content planning for the next cycle used which stories were actually opened — cutting unused branches and doubling down on paths that carried live demos.
- Module opens
- Branch usage
- Return paths
- Context split
- Unused modules
Client confidential — delivered for a brand presenting in this context. The client name is withheld under NDA.
+ Related analytics
Want this level of insight from your next event?