Analytics InnoTrans · 2 min read
InnoTrans 3D Interaction Analytics
InnoTrans 2024 · Berlin, Germany
Hall interaction & mobility exhibits
- Role
- 3D analytics lead
- Context
- InnoTrans · Interactive 3D rail display
- Stack
- 3D Interaction Events · Google Tag Manager · Hotspot Interest
- Worked with
- Product engineering, Exhibition design, Presentation staff
Overview
Representative sample data
Unique visitors
3,503▲ +34% vs. baselineSessions
12,147▲ +35% vs. baselineInteractions
32,732▲ +23% vs. baselineAvg. engagement
03:23▲ +14% vs. baselineQualified leads
748▲ +30% vs. baselineEngagement by day
Top experiences
Visitors by region
- North America52%
- Europe24%
- Asia Pacific13%
- Latin America6%
Representation only. This dashboard and its figures are generated sample data that show the kind of reporting I build. No client data, client names or client-related work is used or shared here.
01 The question
Large 3D stories attract crowds, but without interaction tagging it is hard to prove which system views and hotspots mattered.
Measure meaningful 3D interactions — view changes, hotspot opens and guided vs free explore — for post-show engineering and marketing review.
3D earns budget when you can show which relationships people actually reached for.
02 What we tagged
I defined interaction events with engineering and presentation staff, instrumented the 3D display, configured GTM, and built interest boards for Berlin follow-up.
Interaction tags lived in the InnoTrans 3D platform — view selects and hotspots shared names with the engineering and presentation scripts.
- Interactive 3D rail system display
- Hero product views and annotations
- Guided staff tours vs self-serve explore
- Hotspot and system-relationship stories
- 01Hero view select
- 02Hotspot open
- 03Annotation open
- 04Guided vs self-serve mode
- 05Session depth
03 The pipeline
From a tap on the floor to a chart in the debrief.
Interaction tags lived in the InnoTrans 3D platform — view selects and hotspots shared names with the engineering and presentation scripts.
04 The dashboard
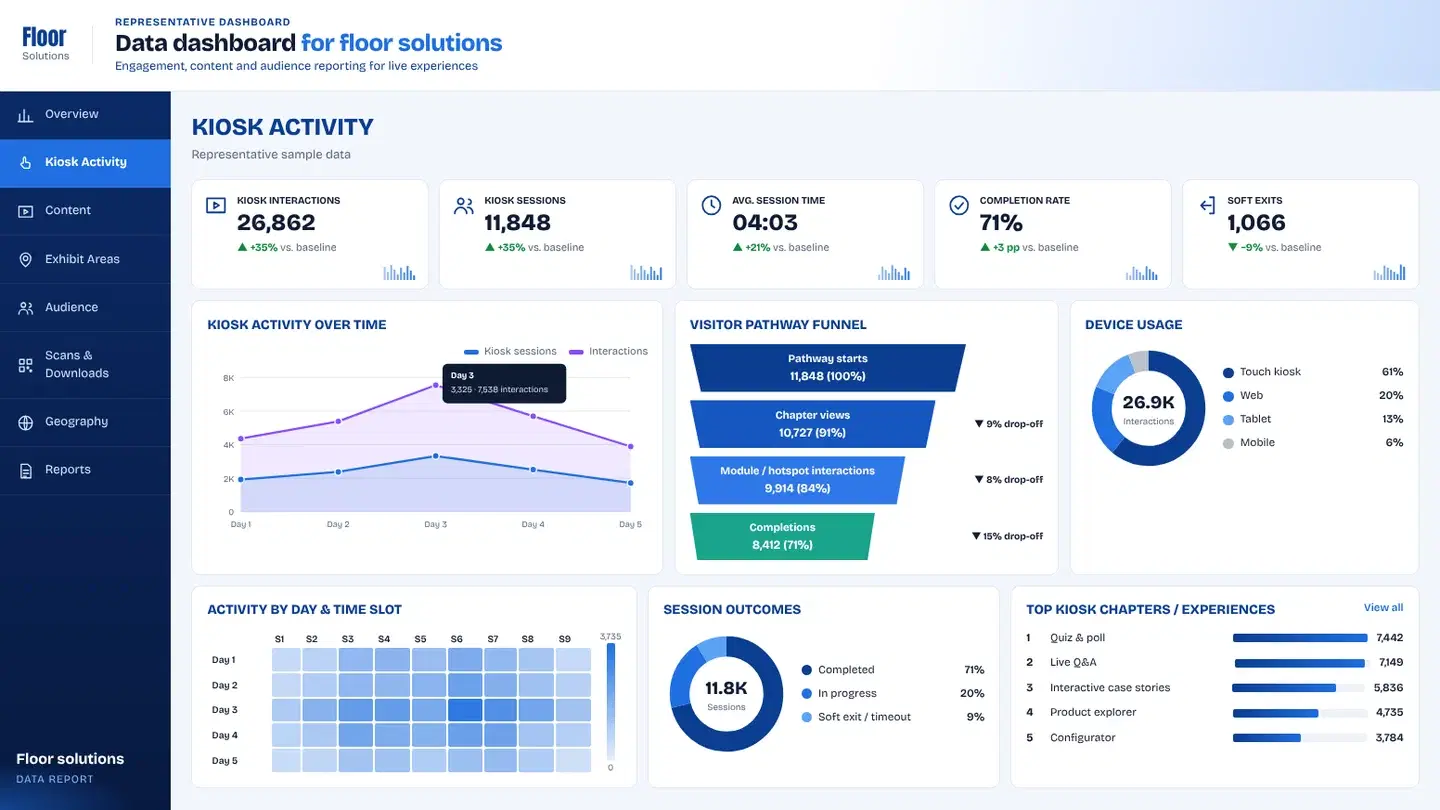
Tabs show which spatial relationships visitors reached for — for engineering and marketing alike.
- 01Overview
Sessions, depth and mode mix for the hall.
- 02Views & hotspots
Which system views and annotations earned attention.
- 03Modes
Guided tour vs free explore — honest comparison.
- 04Reports
Berlin follow-up packs for product and exhibition teams.
Key takeawayDashboards highlighted which system relationships visitors explored most.
▶ Try the dashboard
Every tap, tagged — explore a working board.
A live demo of the same capture-to-dashboard setup, with sample data instead of client numbers.
 The experience we measuredInnoTrans 3D Product DisplayA large-scale interactive 3D rail experience for InnoTrans — built to make complex systems understandable on the floor.Read the case study
05 What changed
Large 3D stories attract crowds, but without interaction tagging it is hard to prove which system views and hotspots mattered.
- 01
Product and exhibition teams aligned on which spatial stories to invest in — and which annotations to simplify for the next mobility show.
- View selects
- Hotspot opens
- Guided vs self-serve
- Session depth
- Top annotations
Client confidential — delivered for a brand presenting in this context. The client name is withheld under NDA.
+ Related analytics
Want this level of insight from your next event?