Analytics HIMSS Global · 2 min read
HIMSS Global Showcase Analytics
HIMSS Global 2023 · Chicago, USA
Attendee flow & exhibit heatmaps
- Role
- Showcase analytics lead
- Context
- HIMSS Global · Self-guided product showcase
- Stack
- Product Zone Tagging · Google Tag Manager · Touch Analytics
- Worked with
- Global marketing, Regional field teams, Creative agency
Overview
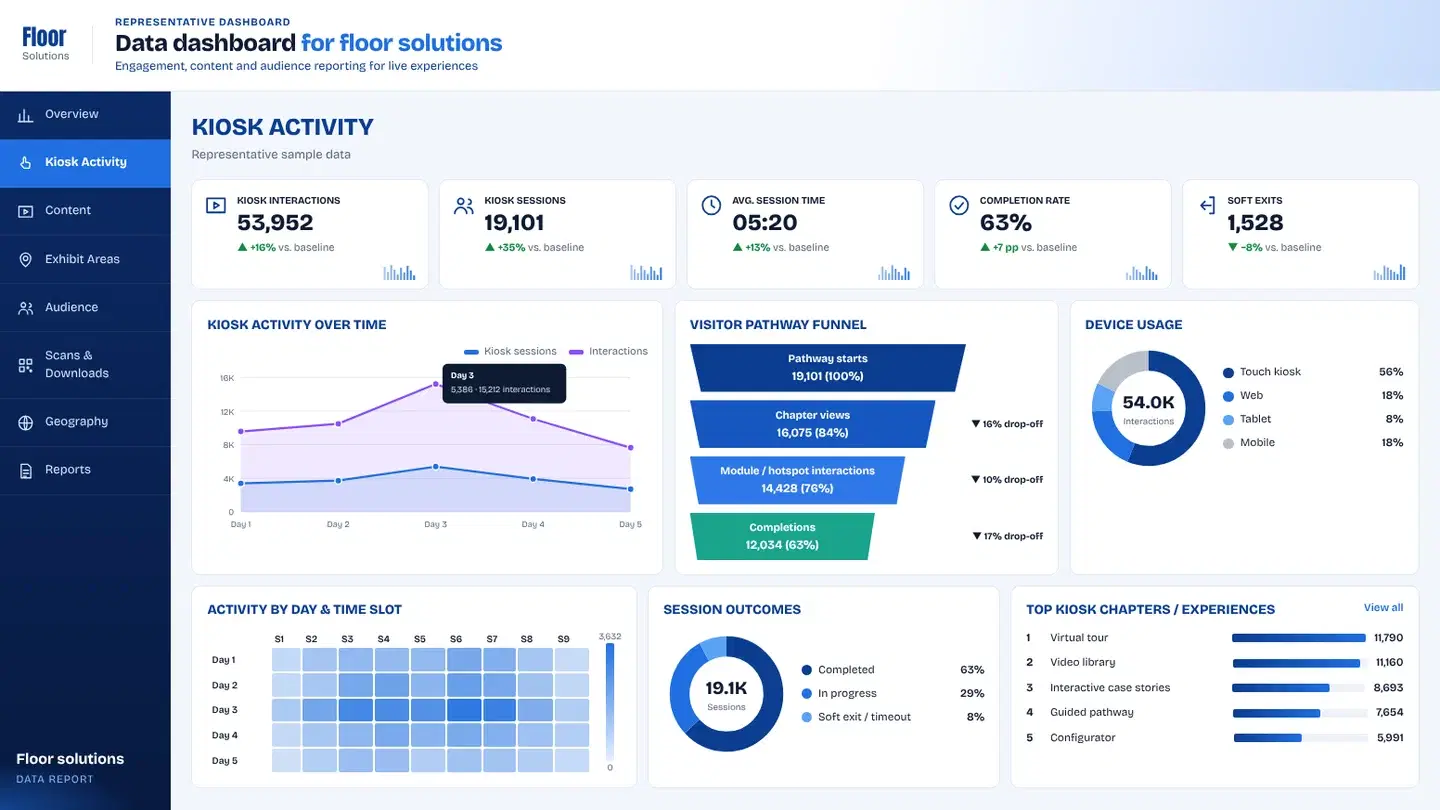
Representative sample data
Unique visitors
5,029▲ +20% vs. baselineSessions
15,732▲ +10% vs. baselineInteractions
46,043▲ +26% vs. baselineAvg. engagement
03:10▲ +12% vs. baselineQualified leads
501▲ +24% vs. baselineEngagement by day
Top experiences
Visitors by region
- North America46%
- Europe29%
- Asia Pacific18%
- Latin America6%
Representation only. This dashboard and its figures are generated sample data that show the kind of reporting I build. No client data, client names or client-related work is used or shared here.
01 The question
International traffic moved fast through product zones.
Without zone-level measurement, global teams could not compare interest across regions of the story.
Report engagement by product area, visit depth and completion so regional leads shared one language after the show.
Global shows need global metrics — same definitions, different booths.
02 What we tagged
I aligned zone tagging with global marketing, instrumented the showcase platform, set up GTM, and delivered Looker engagement breakdowns by product area.
Zone tags were built into the HIMSS Global showcase platform — same event names whether a visitor was in imaging, workflow or services.
- Self-guided product showcase zones
- Regional product stories
- Compare and content-open actions
- Cross-region field briefing views
- 01Zone enter
- 02Content open
- 03Compare actions
- 04Exit / completion
03 The pipeline
From a tap on the floor to a chart in the debrief.
Zone tags were built into the HIMSS Global showcase platform — same event names whether a visitor was in imaging, workflow or services.
04 The dashboard
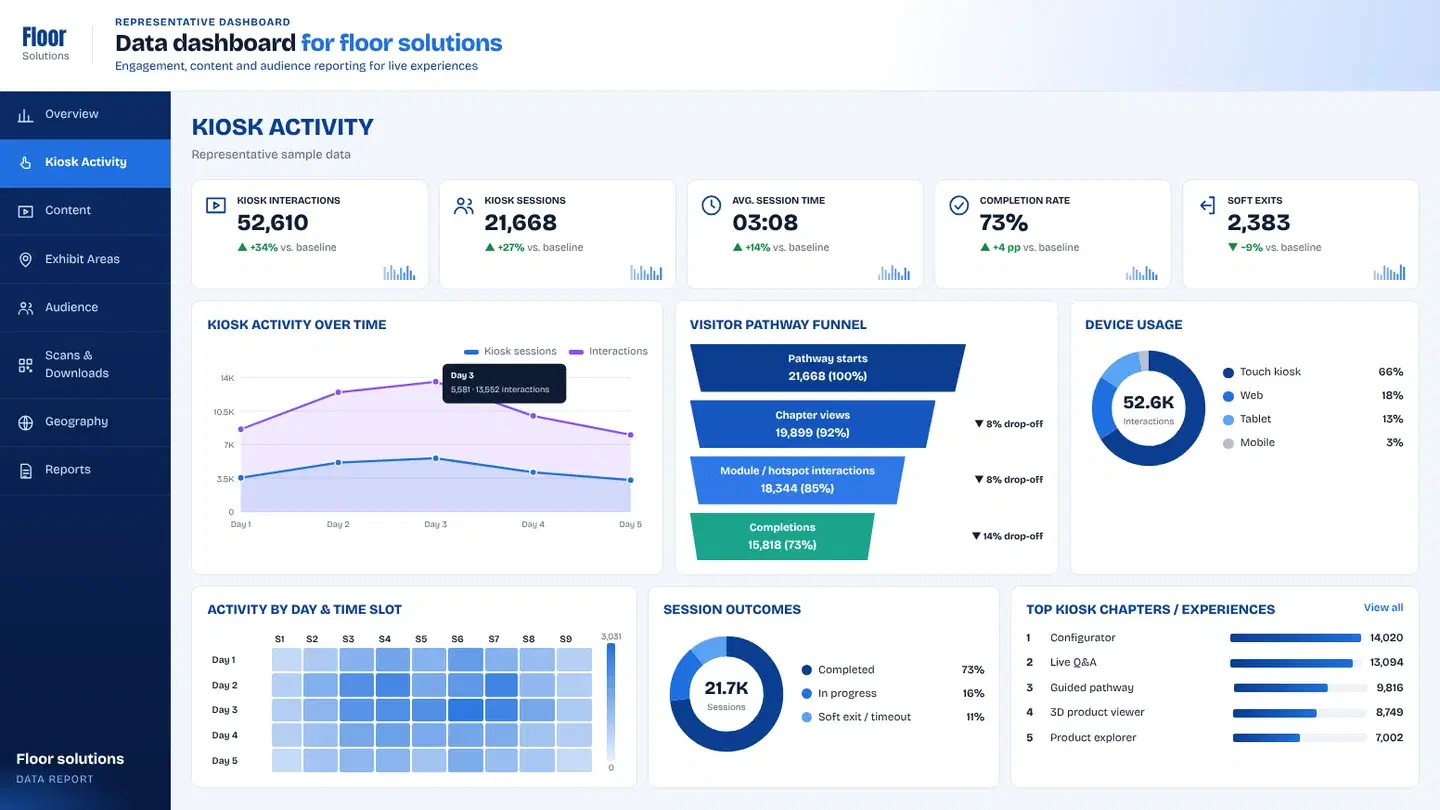
Tabs give global and regional teams one vocabulary for product-area interest.
- 01Overview
Visit depth and completion across the showcase.
- 02Product zones
Heat-style interest by area for field and marketing.
- 03Geography
Regional patterns when available for global briefings.
- 04Reports
Shared exports for multi-region debriefs.
Key takeawayHeat-style interest by product zone plus depth metrics for post-show global review.
▶ Try the dashboard
Every tap, tagged — explore a working board.
A live demo of the same capture-to-dashboard setup, with sample data instead of client numbers.
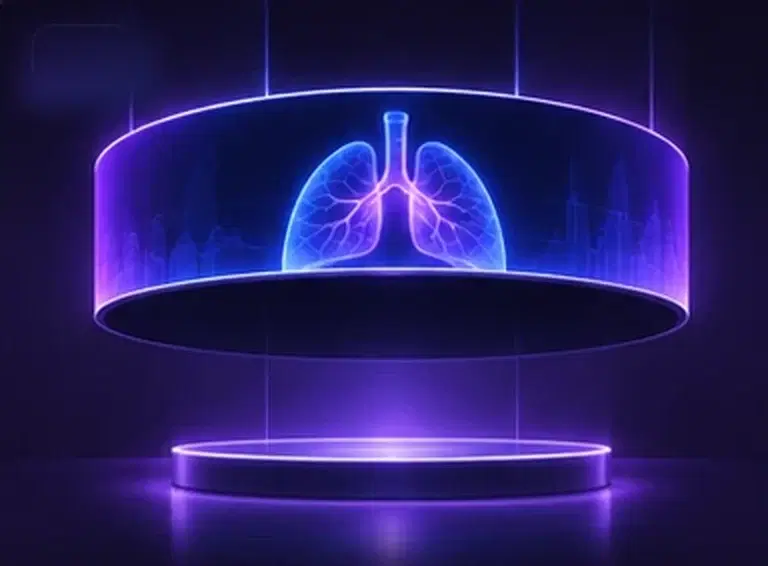 The experience we measuredHIMSS Global Product ShowcaseA self-guided product showcase for HIMSS Global — built for exhibit-hall traffic and short, decisive visits.Read the case study
05 What changed
International traffic moved fast through product zones. Without zone-level measurement, global teams could not compare interest across regions of the story.
- 01
Field and marketing debated content priority with evidence — which product zones and services to expand, localize or retire.
- Zone interest
- Visit depth
- Content opens
- Completions
- Daily patterns
Client confidential — delivered for a brand presenting in this context. The client name is withheld under NDA.
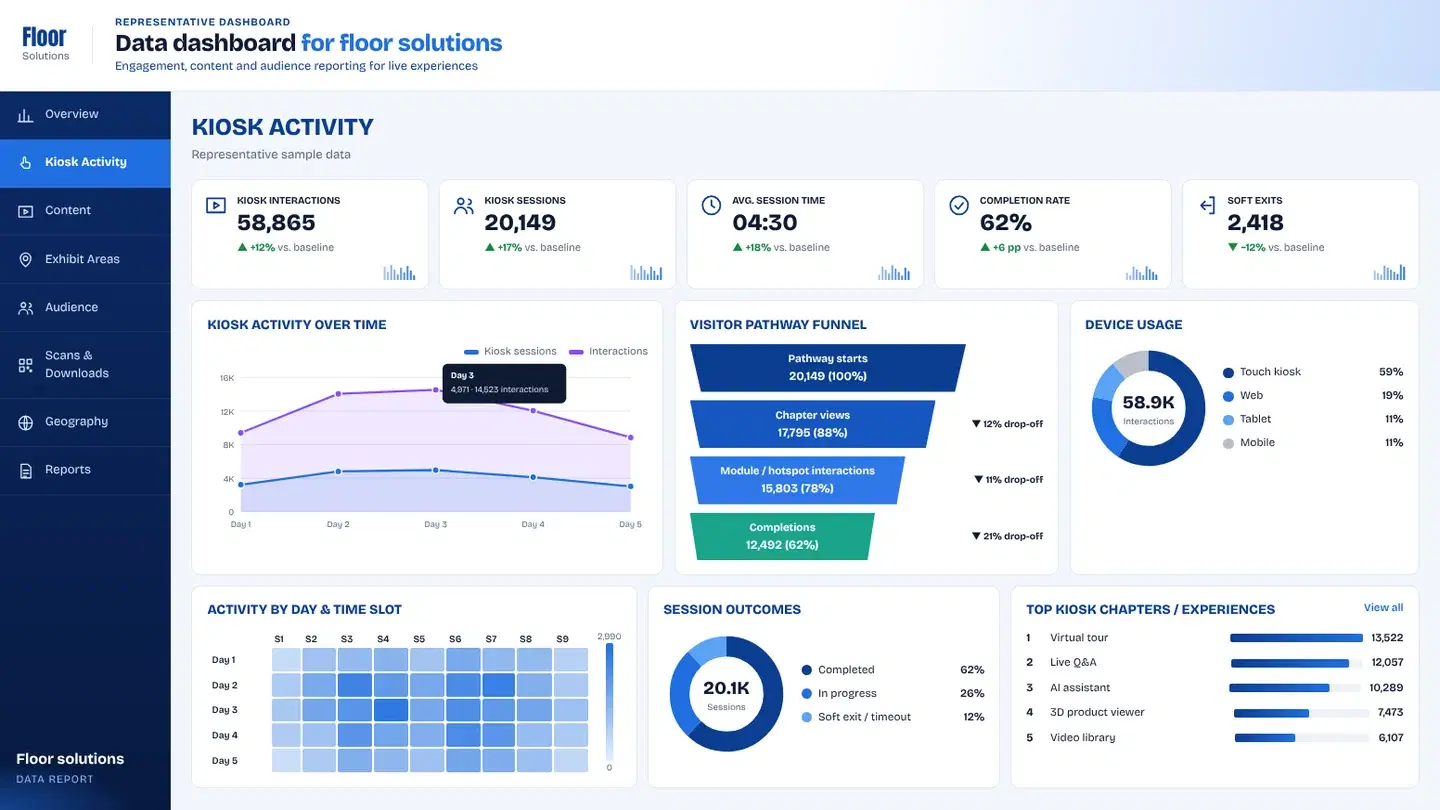
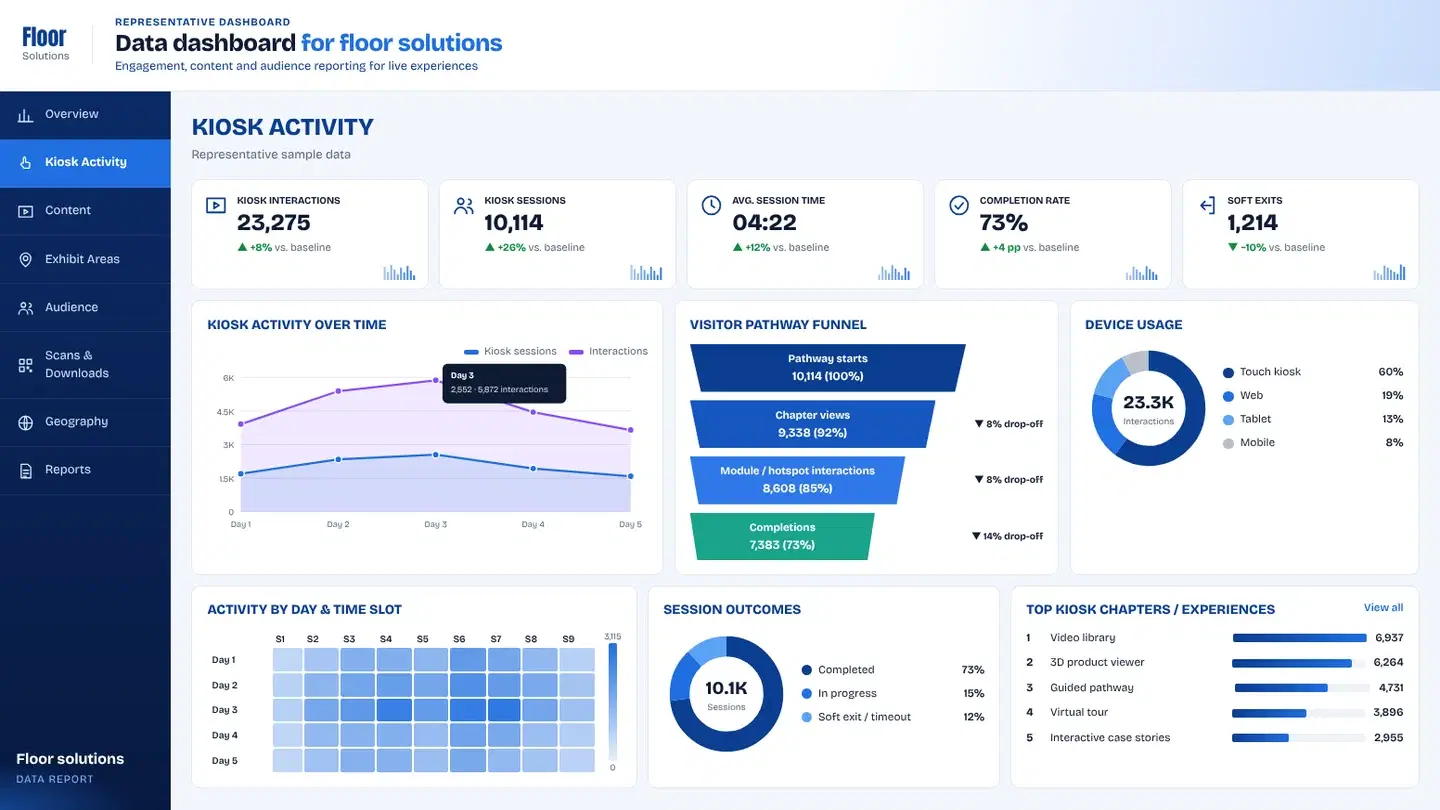
+ Related analytics
Want this level of insight from your next event?